Figures & data
Figure 1. Dose profile over the target volumes in a DPBC plan, showing the steep gradients of the prescribed dose (52.8 Gy to PTV3, 60 Gy to PTV2, 69.7 Gy to PTV1, 73.1 Gy to PTV-solid and 79.7 Gy to PTV-PET) and the smoother gradients of the achieved plan dose.
Table I. Prescription doses, mean doses and doses covering 95% of the target volume.
Table II. Comparison of the dose-painting plans of different prescription approaches by means of four different scalar measures.
Figure 2. The QVH of a suboptimal plan (solid line), shown in relation to the ‘normal zone’ of the QVH tool. The plan was re-optimized and could be improved (dotted line).
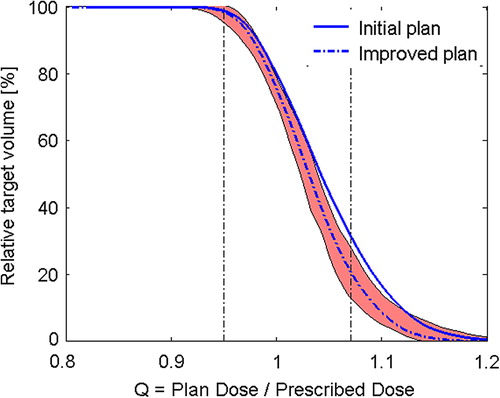
Figure 3. A suboptimal dose-painting plan shown in quality color wash. Values of Q > 107% (overdosage) appear in red and Q < 95% (underdosage) appear in blue. The high degree of overdosage occurs, inter alia, in the position of the right submandibularis (dark blue contour).
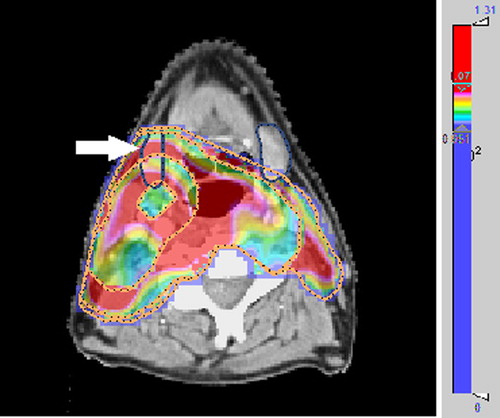
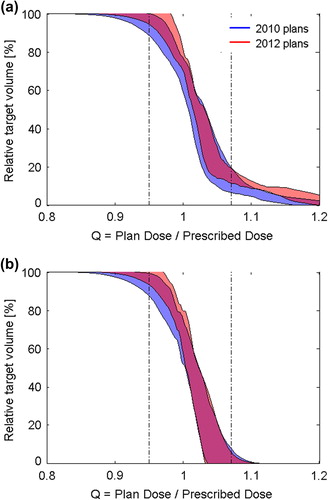
Figure 4. Comparison by means of the QVH tool between 2010 and 2012 hypopharyngeal treatment plans. The dose is reported for specific PTVs without (a) and with (b) optimization margins between them.