Figures & data
Table I. Cancer patients diagnosed from 1993–2004 in Osaka Japan by deprivation group.
Table IIA. Temporal change and deprivation gap in one-year net survival and change in deprivation gap from 1993–2004 in Osaka, Japan.
Table IIB. Temporal change and deprivation gap in five-year net survival and change in deprivation gap from 1993–2004 in Osaka, Japan.
Table IIC. Temporal change and deprivation gap in five2year conditional survival and change in deprivation gap from 1993–2004 in Osaka, Japan.
Figure 1. (A) Association between the average level of one-year net survival and the deprivation gap in one-year net survival in 1993–2004 in Osaka, Japan. (B) Association between the average level of five-year net survival and the deprivation gap in five-year net survival in 1993–2004 in Osaka, Japan. (C) Association between the average level of five-year conditional survival and the deprivation gap in five-year conditional survival in 1993–2004 in Osaka, Japan.
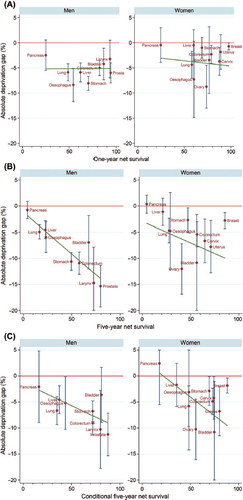
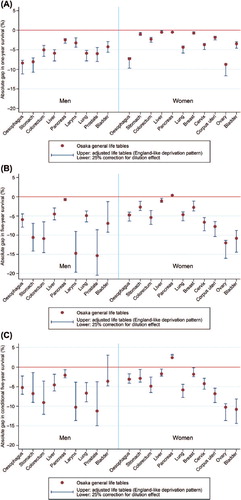
Figure 2. (A) Sensitivity analysis of the deprivation gap in one-year net survival based on three different life tables in 1993–2004 in Osaka, Japan. (B) Sensitivity analysis of the deprivation gap in five-year net survival based on three different life tables in 1993–2004 in Osaka, Japan. (C) Sensitivity analysis of the deprivation gap in conditional five-year survival based on three different life tables in 1993–2004 in Osaka, Japan.