
Figures & data
Figure 1. Levels of arterial ligation extracted from the registry.
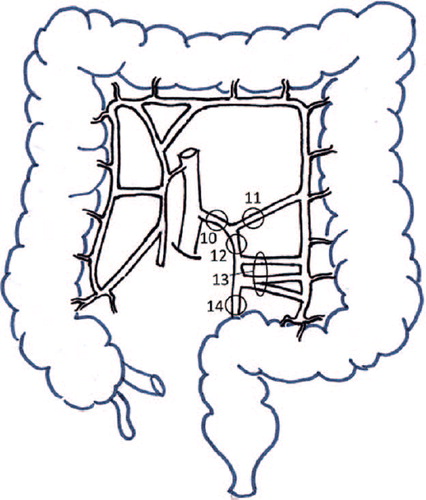
Figure 2. Levels of arterial ligation levels extracted from operative charts. (A) High tie; (B) Low tie; (C) Combination tie.
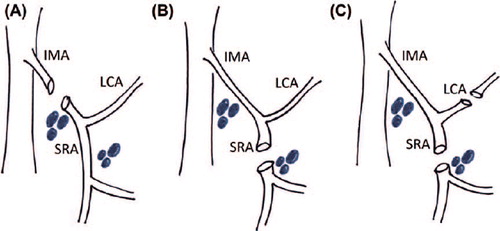
Table I. Clinical data for 744 patients operated with anterior resection for rectal cancer in Sweden during 2007–2010.
Table II. Extracted versus registered tie levels in 744 patients operated with anterior resection for rectal cancer in Sweden in 2007–2010.
Table III. Sensitivity, specificity, PPV and NPV with corresponding 95% CI, as well as level of agreement and Cohen's kappa for different levels of tie.