Figures & data
Figure 1. Dose distribution on a free breathing midventilation scan (left side) resulted in MLD of 21.1 Gy and V20 of 40.5%.which exceeded the lung tissue constraints. Treatment plan on a DIBH scan (B right side) decreased MLD to 19.7 Gy and V20 to 35.8%. Lung volume increased by 67%.
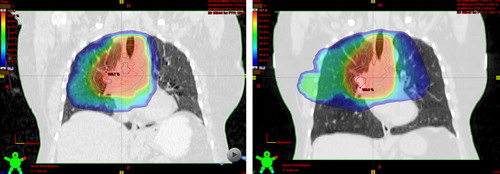
Figure 2. The increased lung volume in DIBH moved the targets apart, increasing MLD and V20 in DIBH (right) compared to the free breathing (left) from 23.1 Gy to 21.2 Gy and from 49% to 40%, respectively.
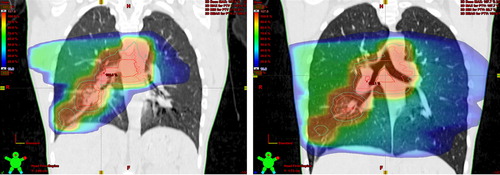
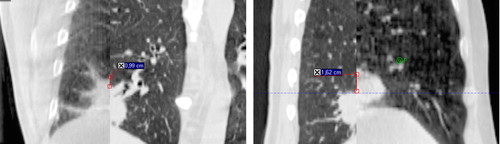
Figure 3. A large mismatch of the caudal target of patient #3 on the 10th treatment day shown in split window of the planning CT (left) and CBCT (right) in coronal and sagittal views.