
Figures & data
Figure 1. Random sampling of patients stratified on type and laterality of operation was carried out in four departments. Dose distributions were recalculated with various methods as indicated. AAA, anisotropic analytical algorithm; CCA, enhanced collapsed cone algorithm; FMU, fixed monitor units; PB, pencil beam algorithm; S. size, sample size.
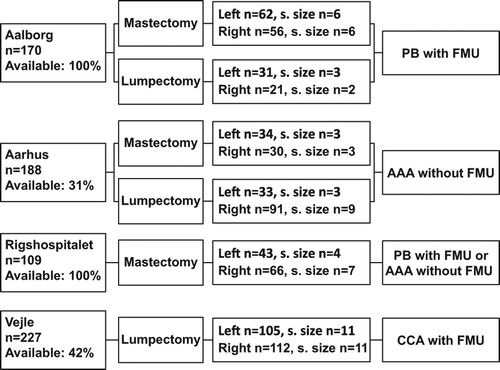
Table I. Estimates of doses to internal mammary nodes and organs at risk in 68 original treatment plans.
Table II. Left-side average estimates of dose coverage for internal mammary nodes and organs at risk with and without internal mammary node radiotherapy.
Table III. Dose estimates resulting from three different calculation methods.