Figures & data
Figure 1. Simple models of tumour oxygenation: (a) uniformly oxic tumour with OER = 1, (b) uniformly anoxic tumour with OER = 3, and (c) partly hypoxic tumour with 20% hypoxia (OER = 3).
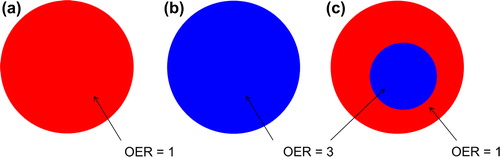
Figure 2. Survival curves obtained with the LQ (solid curves) and USC (dashed curves) models. Red curves represent a uniformly oxic tumour with OER = 1, blue curves represent a uniformly anoxic tumour with OER = 3, and purple curves represent an intermediate case of a partly hypoxic tumour with 80% OER = 1 and 20% OER = 3.
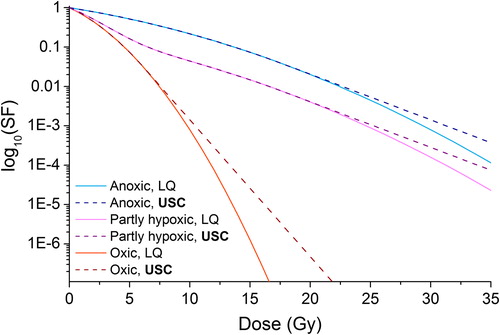
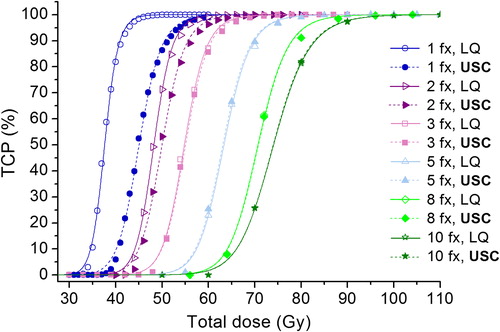
Figure 3. Dose-response curves for the various fractionation schedules as a function of total dose delivered to a tumour with 1.1% hypoxic fraction. Calculations have been done based on both the LQ model (solid curves) and the USC model (dashed curves).