Figures & data
Figure 1. Box-plot of the fraction of counts saved in the PET/CT patient study by each method. Whiskers define the maximum and minimum value of the counts saved, while the horizontal line defines the median of the counts saved.
![Figure 1. Box-plot of the fraction of counts saved in the PET/CT patient study by each method. Whiskers define the maximum and minimum value of the counts saved, while the horizontal line defines the median of the counts saved.](/cms/asset/1c19eae5-c031-4057-8d6a-3cd202eb3bd0/ionc_a_926028_f0001_b.gif)
Figure 2. Example case of a patient, showing a clear increase in SUVmax and SUV mean with reduction of lesion volume.
![Figure 2. Example case of a patient, showing a clear increase in SUVmax and SUV mean with reduction of lesion volume.](/cms/asset/8cf3fe3d-015f-41bc-8e44-78cefe748603/ionc_a_926028_f0002_b.jpg)
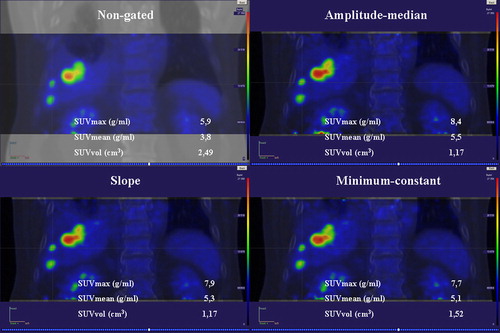
Table I. Measured SUVmax and SUVmean values with each gating method.