Figures & data
Figure 1. CBCT scans of the PMMA HN phantom of 12, 16, 18 and 20 cm diameter with 12 different Gammex RMI density inserts positioned in the center one at a time. (a) and (b) Measured mean CT numbers and standard deviations from SDH mode with OBI and FFE image reconstruction, respectively, as a function of phantom diameter (abbreviations in Material and methods). Similar results for HQH mode are depicted in (c) and (d). Assuming a linear dependence, (e) and (f) show the change in CT number per phantom diameter (ΔHU/Δcm) plotted as a function of increasing insert EDR for the SDH data in (a) and (b) and the HQH data in (c) and (d), respectively. Error bars correspond to ± one standard error from linear regression. For comparison the equivalent CT data have been added on both.
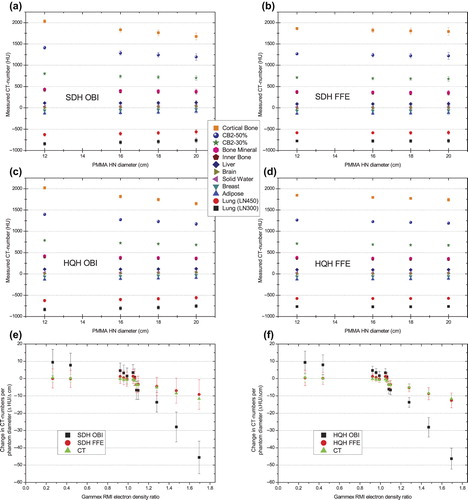
Figure 2. CBCT scans of the PMMA HN phantom of 12, 16, 18 and 20 cm diameter with 12 different Gammex RMI density inserts positioned in the center one at a time. (a) and (b) Calculated versus measured CT numbers from stoichiometric calibration models of SDH and HQH modes fitted for the four different phantom sizes and two reconstruction methods. (c) and (d) The corresponding HU-EDR curves. The two inserts show zooms around the highest EDR value (cortical bone).
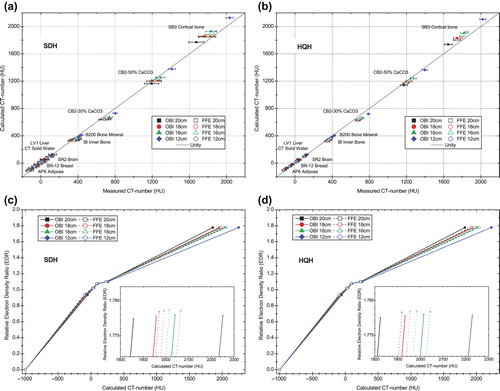
Figure 3. CBCT scans of CIRS 18cm diameter phantom with cyclic permutation of insert positions. (a) The measured mean CT number and standard deviation for each insert in either the center or eight periphery positions as a function of mode and reconstruction method. (b) The measured CT number in the center minus periphery for each insert plotted as a function of increasing EDR for the inserts. For comparison the equivalent CT data have been added. Error bars correspond to ± one standard error of the mean.
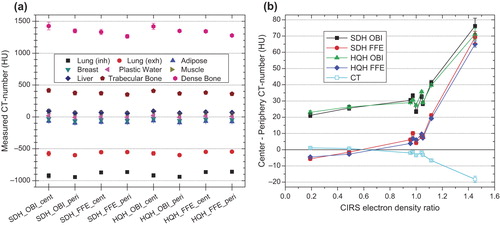
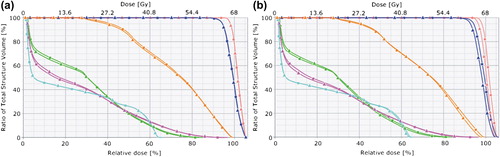
Figure 4. DVH plot of CTV (pink), PTV (blue), spinal cord (cyan), left parotid (green), right parotid (magenta), and mandible (orange) comparing IMRT plan on CT (solid square) and HQH CBCT (solid triangle) in FFE reconstruction. (a) HU-EDR curve calibrated with CIRS phantom on both CT and CBCT. (b) HU-EDR curve from Gammex on CT and Catphan on CBCT, respectively.