
Figures & data
Table I. Patient characteristics.
Table II. Baseline and peak acute morbidity.
Figure 1. Median bowel cavity DVHs for patients with or without grade 2 + acute diarrhoea. Significant difference at 10 Gy, 20 Gy, 30 Gy, 40 Gy and 50 Gy (* p < 0.05).
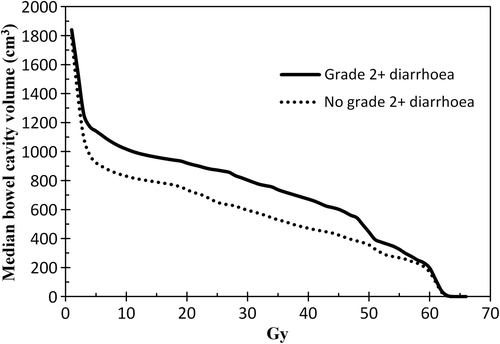
Figure 2. Logistic regression curve for the risk of grade 2 + acute diarrhoea as a function of the bowel cavity receiving a dose of 45 Gy or higher (V45Gy). The individual points represent the risk acute diarrhoea for six groups of 19–21 patients each arranged according increasing volume of bowel cavity receiving a dose of 45 Gy or higher.
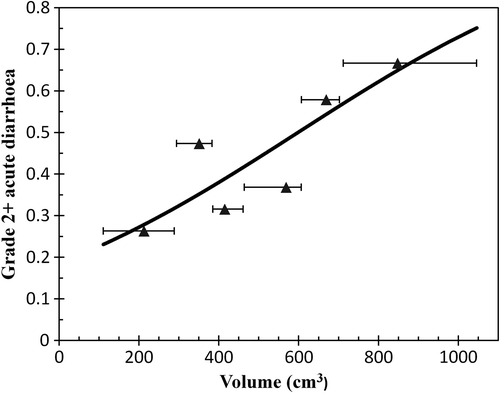
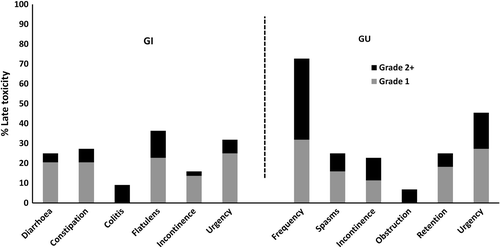
Figure 3. Late gastrointestinal (GI) and genitourinary (GU) toxicity (CTCAE v.3) in the total patient cohort.
Supplemental material