Figures & data
Figure 1. Plan selections performed for each of the 20 patients and 30 fractions. The first five fractions with large size plan correspond to the first week of treatment. Patient no. 12 had a pre-treatment boost of 10 Gy and plan selection was performed from first fraction in the ART treatment.
Figure 2. Box plot of volumes for CTV, PTVsmall , PTVmedium , PTVlarge and PTVcourse. The boxes are 25–75 percentiles with median as line inside the box, whereas upper and lower limits are the 95 and 5 percentiles.
Figure 3. Linear fit of PTVcourse as a function of CTV for ART (black line) and non-ART (grey line). Assuming a spherical bladder shape, it can be shown also theoretically that the PTV is roughly a linear function of the CTV when the margin is much smaller than the radius of the sphere.
Figure 4. Population-average DVHs for bowel cavity (upper part) and rectum (lower part) for patients treated with RT to the bladder only (left) as well as patients where both the bladder and the pelvic lymph nodes were treated (right). The dotted lines represent one standard deviation and all curves are based on planCT data.
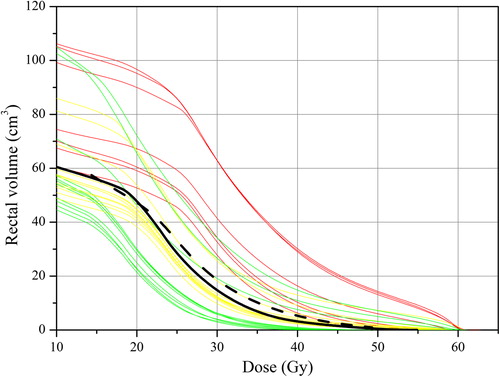
Figure 5. Rectal DVHs for one patient treated to the bladder only, showing the individual DVHs for each of the 30 treatment fraction with the adaptive scheme using anatomy from CBCTs (scaled to the full treatment dose), together with the average/summed DVH over each volume bin (dashed line) as well as the DVH for ART calculated on the planCT (solid black line). Doses below 10 Gy are not shown.