Figures & data
Figure 1. Illustration of the mapping of spatial differences between automatic and manual delineations. a) an automatic heart delineation in 3D. Along the surface of the heart the deviation between manual and automatic segmentations is mapped as illustrated by the arrows. b) one of these arrows in 2D showing how the difference is calculated between the median manual delineation and the automatic. These differences along the surface of the heart are mapped using an Eckert IV projection, with anatomical directions as shown in c).
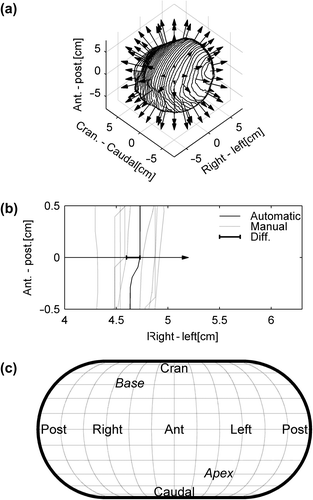
Figure 2. Bland-Altman plots of difference in volume, mean and maximum dose given by automatic and manual delineation without common guidelines (baseline 1). Solid horizontal lines is mean difference and dashed lines is the 95% limits of agreements (± 1.96 × SD of the difference). For comparison the 95% limits in manual delineations (± 1.96 × RMS of the inter-observer standard deviation within each patient) is shown to the right of each figure.
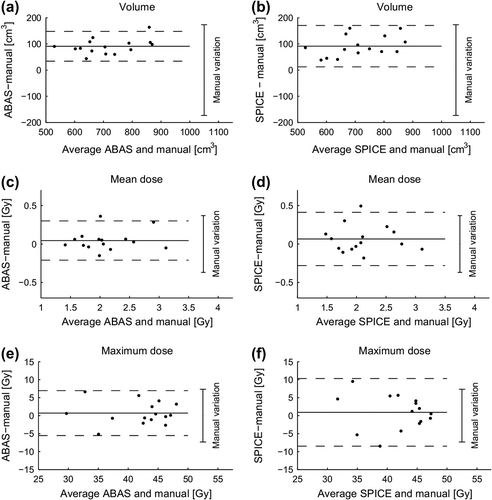
Figure 3. Bland-Altman plots of difference in volume, mean and maximum dose given by automatic and manual delineation with common guidelines (baseline 2). Solid horizontal lines is mean difference and dashed lines is the 95% limits of agreements (± 1.96 × SD of the difference). For comparison the 95% limits in manual delineations (± 1.96 × RMS of the inter-observer standard deviation within each patient) is shown to the right of each figure.
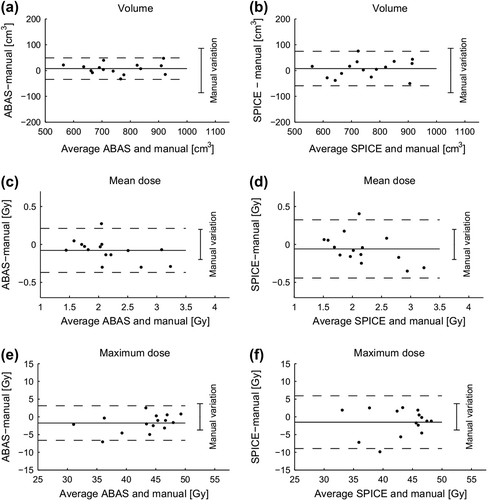
Figure 4. Spatial mapping of heart delineations. a) shows the variation in manual delineations without guidelines as the root mean square of the standard deviation of the delineations in the specific direction within each patient . b) and c) the mean deviation between automatic and median manual delineations without guidelines delineation for ABAS and SPICE respectively. Similar maps are shown in d), e) and f) for manual delineations performed with common guidelines. Anatomical directions of the maps are shown in .
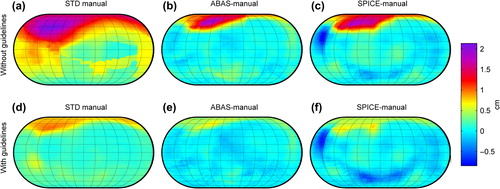
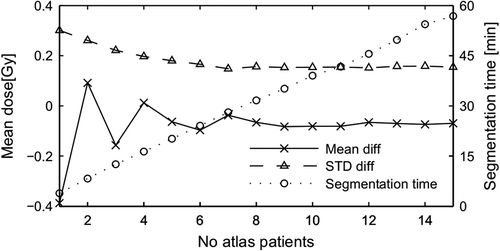
Figure 5. Difference in mean dose for ABAS as function of number of atlas subjects. Two parameters from the Bland-Altman plots, the mean difference (value of solid line in figure 3c) and the standard deviation of the difference for mean dose compared with baseline 2 is shown. Atlas subjects were selected at random starting with one and adding one at random until all 15 patients were selected. Segmentation time is shown as average time per patient.