
Figures & data
Figure 1. Coronal [18F]FECh PET images for the HBCx34, MAS98.06 and MAS98.12 xenografts 90 minutes after [18F]FECh injection. Red line indicates location of bilaterally implanted xenografts. Volumes of interest were delineated in the corresponding computer tomography image.
![Figure 1. Coronal [18F]FECh PET images for the HBCx34, MAS98.06 and MAS98.12 xenografts 90 minutes after [18F]FECh injection. Red line indicates location of bilaterally implanted xenografts. Volumes of interest were delineated in the corresponding computer tomography image.](/cms/asset/b69f93b4-4332-4da6-9834-ab5aae2bca18/ionc_a_934398_f0001_b.jpg)
Figure 2. Mean arterial input functions for the HBCx34, MAS98.06 and MAS98.12 breast cancer xenografts.
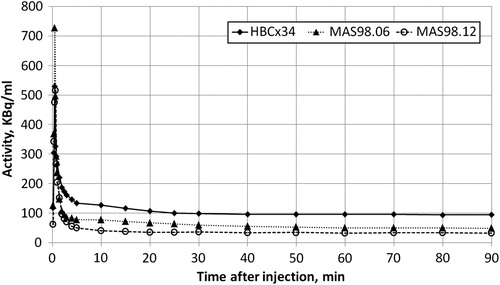
Figure 3. Median SUV curves for the HBCx34, MAS98.06 and MAS98.12 breast cancer xenografts at different time points after injection. Standard deviation for positive direction is shown.
Figure 4. Measured SUV in the individual representative HBCx34, MAS98.06 and MAS98.12 breast cancer xenografts and corresponding fitted curves for a two-tissue compartment model.
Figure 5. (a) Relationship between Patlak slope KP and metabolic rate constant k3. Regression line: y = 1.13x + 0.01, r = 0.57. (b) Relationship between Patlak slope KP and metabolic rate MR[18F]FECh. Regression line: y = 0.87x–0.001, r = 0.97.
![Figure 5. (a) Relationship between Patlak slope KP and metabolic rate constant k3. Regression line: y = 1.13x + 0.01, r = 0.57. (b) Relationship between Patlak slope KP and metabolic rate MR[18F]FECh. Regression line: y = 0.87x–0.001, r = 0.97.](/cms/asset/eda8533f-3226-480d-8869-b30a92f72b6a/ionc_a_934398_f0005_b.gif)
Table I. Mean two-tissue compartment model and Patlak plot parameters and mean SUV for the HBCx34, MAS98.06 and MAS98.12 breast cancer xenografts.
Table II. Pearson's correlation coefficients for two-tissue compartment model and Patlak plot parameters and mean SUV.