
Figures & data
Figure 1. Mean Δtandem center for all MRI examinations as a function of position in millimeters from the top of the applicator ring for the non-corrected DW-MRI (red), B0M (blue) and DIR (black). The error bars represent the standard deviation.
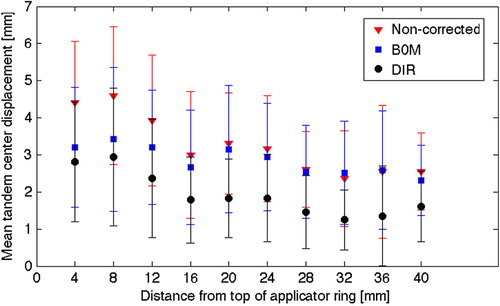
Figure 2. DW-MRI, b = 0 s/mm2, for the three different image sets with GTV (blue contour) and delineated tandem center (yellow contour): (a) non-corrected with full FOV where the white square indicate the zoomed in area shown in the three other images: (b) non-corrected, (c) B0M, (d) DIR.
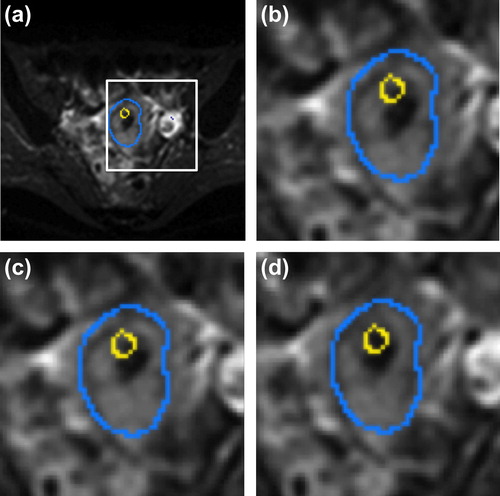
Table I. Displacement of the applicator tandem center.
Supplemental material