Figures & data
Table 1. Baseline characteristics.
Figure 1. Change in skeletal muscle cross sectional area in patients according to sarcopenia. Individual changes in skeletal muscle cross sectional area (SMCA) from pre- to post-chemotherapy (Y-axis) according to sarcopenia at baseline, measured in cm2. Negative values indicate loss in muscle mass. Thresholds for sarcopenia were based on previously reported cut-off values for the skeletal muscle index, which were SMCA/body height 2; ≤ 38.5 cm2/m2 for women and ≤ 52.4 cm2/m2 for men [Citation20]. Non-sarcopenic patients (n=9) are shown in the bars to the left, and sarcopenic (n=26) in the bars to the right. Black bars are SMCA Loss, Dotted grey bars are SMCA Stable and Light grey bars are SMCA Gain.
![Figure 1. Change in skeletal muscle cross sectional area in patients according to sarcopenia. Individual changes in skeletal muscle cross sectional area (SMCA) from pre- to post-chemotherapy (Y-axis) according to sarcopenia at baseline, measured in cm2. Negative values indicate loss in muscle mass. Thresholds for sarcopenia were based on previously reported cut-off values for the skeletal muscle index, which were SMCA/body height 2; ≤ 38.5 cm2/m2 for women and ≤ 52.4 cm2/m2 for men [Citation20]. Non-sarcopenic patients (n=9) are shown in the bars to the left, and sarcopenic (n=26) in the bars to the right. Black bars are SMCA Loss, Dotted grey bars are SMCA Stable and Light grey bars are SMCA Gain.](/cms/asset/2c0d6b42-e06a-4f68-92dc-1998e08f11e3/ionc_a_953259_f0001_b.gif)
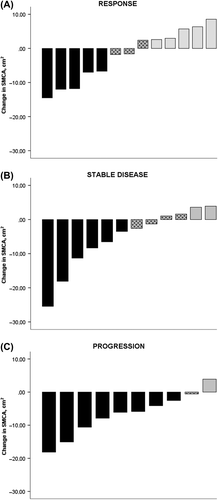
Figure 2. Change in skeletal muscle cross sectional area in patients according to response to treatment. (Includes Figure A, B and C). Individual changes in skeletal muscle cross sectional area (SMCA) from pre- to post-chemotherapy (Y-axis) according to response to treatment, measured in cm2. Negative values indicate loss in muscle mass. Black bars are SMCA Loss, Dotted gray bars are SMCA Stable and Light gray bars are SMCA Gain.

Table II. Courses of chemotherapy, response evaluation and toxicity.
Table III. Uni- and multivariate survival analysis.
