
Figures & data
Table I. Selected comparative dose-volume indices.
Figure 1. (A) Treatment planning axial, sagittal, and coronal CT images of a representative patient with corresponding prostate, rectum, bladder, penile bulb, membranous urethra, and prostatic urethra contours. Isodose lines for the 100% (blue), 50% (purple), and 10% (yellow) prescription dose for the Cyberknife (CK) (left panel) and proton (right panel) treatment plans are shown. (B) Patient-averaged dose-volume histograms of the planning target volume and box plots of the conformality index of CK (blue) and proton (red) treatment plans.
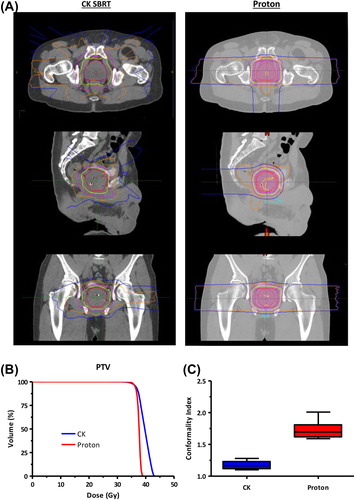
Figure 2. Patient-averaged dose-volume histograms of the organs at risk.
Supplemental material