Figures & data
Table I. Patient, tumor, and preradiotherapy characteristics (N = 313).
Table II. Clinical and dosimetric variables potentially associated with brainstem toxicity.
Figure 1. A comprehensive dose-volume histogram (DVH) including each patient's DVH curve. The colored curves correspond with the 11 patients who experienced toxicities outlined in as follows:
![](/cms/asset/dfc4fdf6-09b9-4664-ae92-f2c0a5a7c4a2/ionc_a_957414_ilg0002.jpg)
![](/cms/asset/2216f8f6-b139-456d-bdb0-45095660c284/ionc_a_957414_ilg0003.jpg)
![](/cms/asset/2948b244-1a76-467f-8471-a0dc55957f2f/ionc_a_957414_ilg0004.jpg)
![](/cms/asset/3996f0c0-f692-4612-81b7-7614a9060cd6/ionc_a_957414_ilg0005.jpg)
![](/cms/asset/3889d949-af27-41d9-97ac-d7cbb2fbf744/ionc_a_957414_ilg0006.jpg)
![](/cms/asset/b074a65e-a524-44c5-8007-88486c06cb1a/ionc_a_957414_ilg0007.jpg)
![](/cms/asset/883e2ee4-1e1c-4597-bde6-f1aeedc9fd72/ionc_a_957414_ilg0008.jpg)
![](/cms/asset/5639c268-57de-48b3-b8e1-d5f03f0dde61/ionc_a_957414_ilg0009.jpg)
![](/cms/asset/467c0e82-4aa6-40a2-a67c-e970eb5dfc9e/ionc_a_957414_ilg0010.jpg)
![](/cms/asset/34a0ab39-a851-4060-a253-b81cabe72d4b/ionc_a_957414_ilg0011.jpg)
![Figure 1. A comprehensive dose-volume histogram (DVH) including each patient's DVH curve. The colored curves correspond with the 11 patients who experienced toxicities outlined in Table III as follows: Display full size 1; Display full size2; Display full size3; Display full size4; Display full size5; Display full size6; Display full size7; Display full size8; Display full size9; Display full size10; Display full size11. The inset provides a magnified view of the high-dose range.](/cms/asset/dc0979e7-955d-472f-8619-aae56338d17d/ionc_a_957414_f0001_b.jpg)
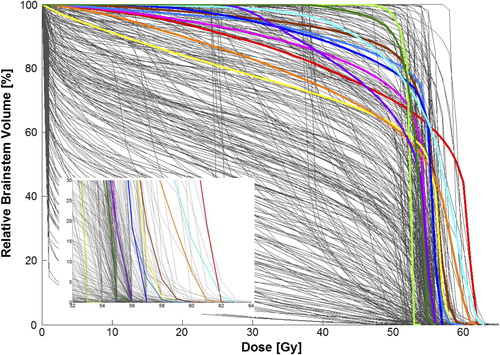
Table III. Patient, tumor, and treatment characteristics for patients who experienced brainstem toxicity.