
Figures & data
Table I. Characteristics of included patients.
Figure 1. Number of negative and positive BMBs among the different radiological-based Ann Arbor stages.
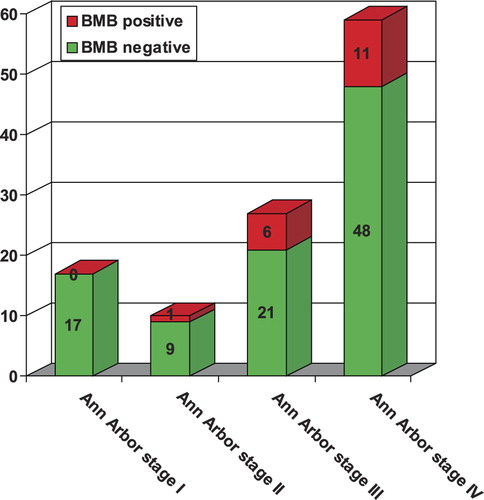
Table II. Cross-tabulation of NCCI-IPI-based risk stratification without versus with taking into account BMB results.