Figures & data
Figure 1. DVH comparison between plan 1 with the bone metastasis group (solid line) and the recalculated plan 2 group without bone metastasis (dashed line). For clarity, bladder wall, rectal wall and PTVsv were excluded. PTVbone DVH (purple line) is only presented for plan 1.
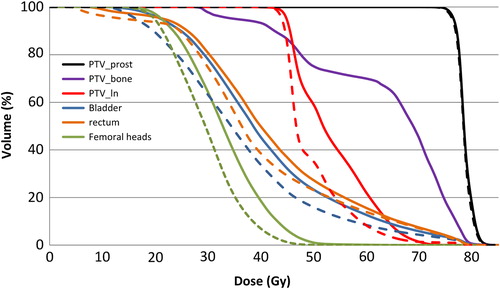
Table I. The DVH data (mean, range) for prostate and lymph node treatment planning volumes (PTVprost, PTVln) for the different plans (described in Material and methods).
Table II. The DVH parameters (mean, range) for rectum and bladder compared to the Quantec recommendations [Citation15–17].
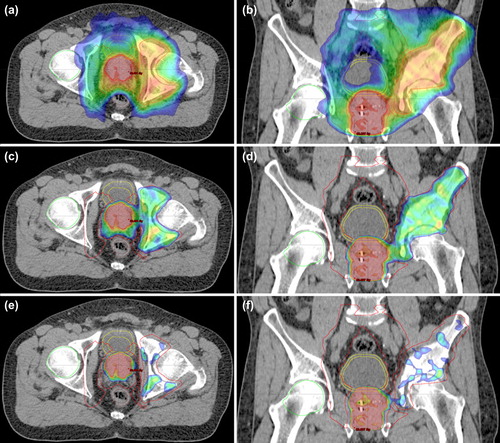
Figure 2. The axial (a, c, e) and coronal (b, d, f) dose distributions of 63-year-old prostate cancer patient with CT+ MR detected metastases in left ilium and acetabulum, and in right parailiac lymph nodes. Pre-treatment PSA was 250 μg/l and Gleason score 9. Patient dose prescription was 45 Gy in 25 fractions (fr) to regional lymph nodes, 50 Gy/25 fr to seminal vesicles and 78 Gy/39 fr to prostate. Bone metastases were treated to 73Gy (45 Gy/25 fr + 28 Gy/14 fr). Dose map ranged from 45 Gy to 78 Gy (a, b), from 69.3 Gy to 78 Gy (c, d) and from 70.1 Gy to 78 Gy (e, f). 1.5 years after the radiation therapy, the PSA was < 0.1 μg/l, the bone metastases were sclerotic, and the lymph node metastasis had shrunk.