Figures & data
Table I. Clinical characteristics and age according to randomization group.
Table II. Mean scores and standard deviations (SD) for the EORTC QLQ-C33 subscales and single items at three points of assessment according to randomization arm.
Table III. Frequencies of prostate cancer-specific problems, patients-reported response categories according to randomization group at three points of assessment.
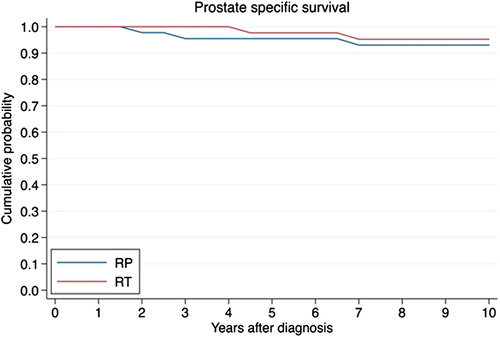
Figure 1. Cumulative probability of prostate-specific survival in RP, radical prostatectomy group compared to RT, radiotherapy group.