2,494
Views
42
CrossRef citations to date
0
Altmetric
Brain tumours

Brain tumors in Sweden: Data from a population-based registry 1999–2012

, , , &
Pages 377-384 | Received 20 May 2014, Accepted 05 Oct 2014, Published online: 10 Nov 2014

Figures & data

Table I. Distribution of patients diagnosed with CT or MRI – high- and low-grade glioma 1999–2012 by region.
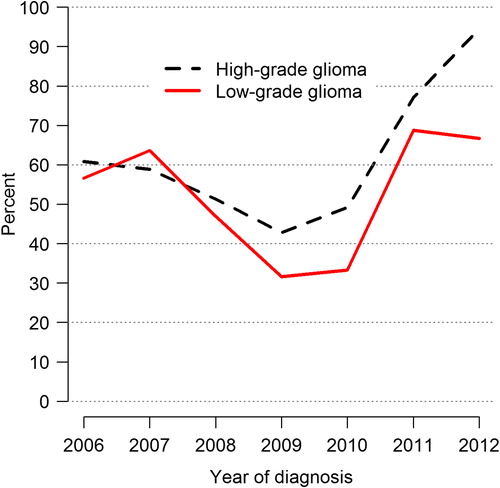
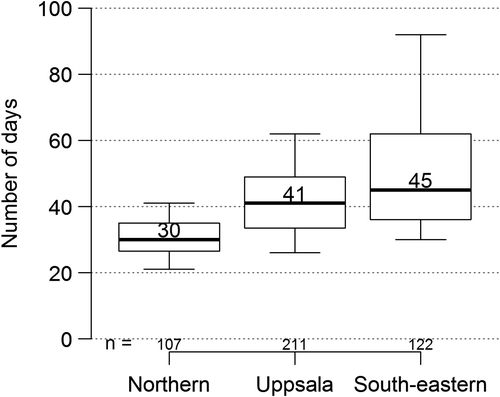
Figure 1. Percent of patients where radiology for evaluation (CT and/or MRI) of surgical radicality has been performed if patient was classified as radically or partially resected, by year of diagnosis. High-and low-grade glioma. Data from the Northern, the Uppsala and the South-eastern regions.
Figure 2. High-grade gliomas 2009–2012: Box-plot illustrating waiting times from surgery to start of oncological treatment by year of diagnosis. The box contains 50% of the waiting times, the line in the box (and the number) is the median and the whiskers contain 80% of the waiting times.
Figure 3. Five year survival by radical surgery, non-radical surgery or biopsy among patients with WHO performance status 0 −3, 1999–2012. High-grade glioma. Data from the Northern, the Uppsala and the South-eastern regions.
Figure 4. Five year survival among high-grade glioma patients by age of diagnosis 1999–2012. Data from the Northern, the Uppsala and the South-eastern regions.
Supplemental material

ionc_a_975369_sm9198.pdf

Download PDF (1.2 MB)

Reprints and Corporate Permissions

Please note: Selecting permissions does not provide access to the full text of the article, please see our help page How do I view content?

To request a reprint or corporate permissions for this article, please click on the relevant link below:

Academic Permissions

Please note: Selecting permissions does not provide access to the full text of the article, please see our help page How do I view content?

Obtain permissions instantly via Rightslink by clicking on the button below:

If you are unable to obtain permissions via Rightslink, please complete and submit this Permissions form. For more information, please visit our Permissions help page.