1,050
Views
4
CrossRef citations to date
0
Altmetric
Breast cancer

Pulmonary function tests – an easy selection method for respiratory-gated radiotherapy in patients with left-sided breast cancer

, , , &
Pages 1025-1031 | Received 11 Jun 2014, Accepted 16 Nov 2014, Published online: 31 Dec 2014

Figures & data

Table I. Patient characteristics for the two groups, group I (n = 16) and group II (n = 18). Mean ± SD and range (in brackets) are shown.
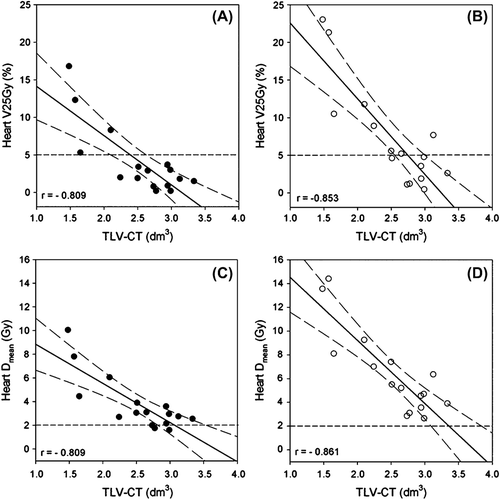
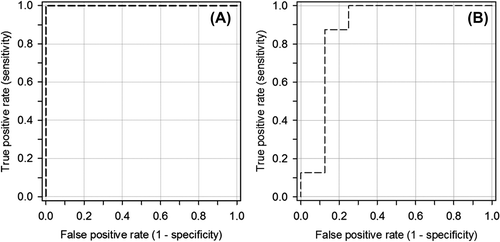
Figure 1. Relative heart volume receiving 25 Gy or more (V25Gy) and mean heart dose (Dmean) for PTV1 (A and C) and PTV2 (B and D) plotted against total lung volume (TLV-CT), measured in CT series acquired during FB for patients in group I (n = 16). Presented is the estimated regression line (solid line) with 95% confidence interval (dotted lines) and Pearson's correlation coefficient, r. The dotted line in A and B represent V25Gy = 5%, and the dotted line in C and D represent Dmean = 2 Gy.
Figure 2. ROC curves for patients from group I (n = 16) with PTV1 (A) and PTV2 (B) as target volume, in a setting where the total lung volume (TLV-CT) during free breathing (FB) was selected as predictor for getting a heart dose higher than recommended in the national guidelines (V25Gy > 5%) at the time when the study was conducted. The TLV-CT cut-off values with the highest summarized value of sensitivity and specificity were determined to be 2.2 and 2.7 dm3 for patients with PTV1 and PTV2, respectively.
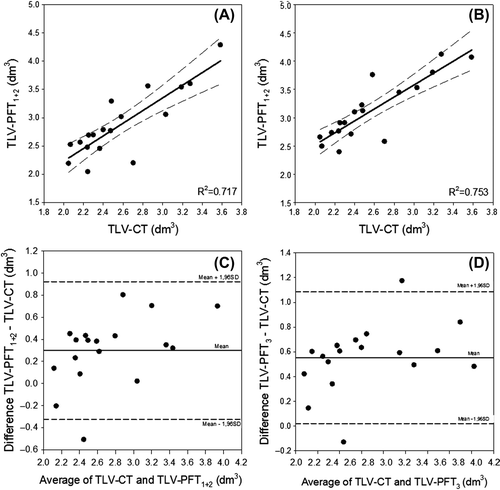
Figure 3. Scatterplots of TLV-CT versus TLV-PFT1 + 2 (A) and TLV-PFT3 (B), respectively. Presented is the estimated regression line (solid line) with 95% confidence interval (dotted lines). The estimated R2 is 0.717(p < 0.01) and 0.753 (p < 0.01) for the plot in Figures A and B, respectively. Corresponding Bland-Altman plots are shown in the lower part of the figure.
Supplemental material

ionc_a_990107_sm8632.png

Download PNG Image (52.3 KB)

Reprints and Corporate Permissions

Please note: Selecting permissions does not provide access to the full text of the article, please see our help page How do I view content?

To request a reprint or corporate permissions for this article, please click on the relevant link below:

Academic Permissions

Please note: Selecting permissions does not provide access to the full text of the article, please see our help page How do I view content?

Obtain permissions instantly via Rightslink by clicking on the button below:

If you are unable to obtain permissions via Rightslink, please complete and submit this Permissions form. For more information, please visit our Permissions help page.