
Figures & data
Figure 1. Selection process of eligible trials for inclusion in review.
Table I. Characteristics of included studies.
Figure 2. Risk of bias across each item of the Newscastle-Ottawa Scale.
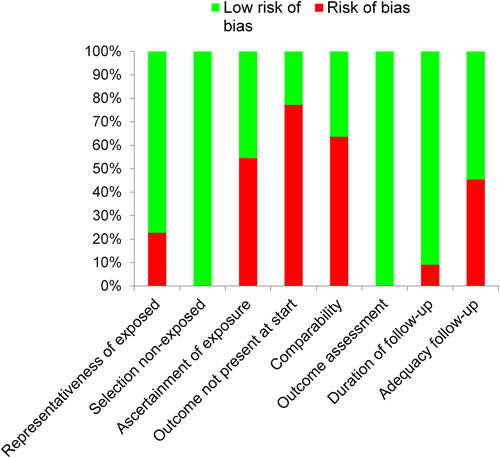
Table II. Risk of bias summary: review authors’ judgments about each risk of bias item for each included study using the Newcastle-Ottawa Scale.
Figure 3. Funnel plot of lifetime pre-diagnosis recreational physical activity and all-cause death. The effect estimate line is shown as a dashed line.
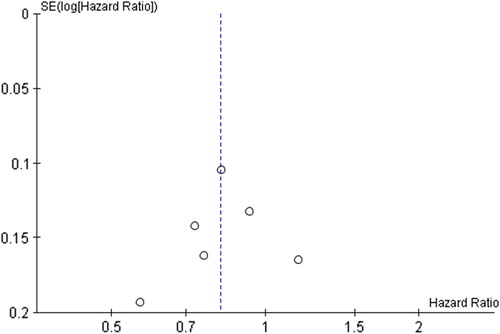
Figure 4. Forest plot with random effects overall hazard ratio for association between lifetime recreational (pre-diagnosis) physical activity (highest vs. lowest physical activity categories) and all-cause death in breast cancer survivors. Red squares indicate hazard ratios (HRs), and solid horizontal lines represent 95% confidence intervals (CIs). The vertical solid line indicates point of no effect. Black diamond indicates overall effect.
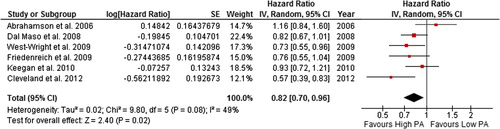
Figure 5. Forest plot with random effects overall hazard ratio for association between lifetime recreational (pre-diagnosis) physical activity (highest vs. lowest physical activity categories) and breast cancer-related death in breast cancer survivors.
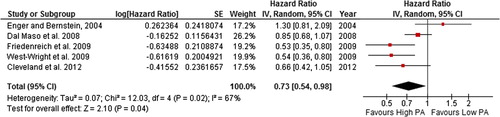
Figure 7. Forest plot with random effects overall hazard ratio for association between recent pre-diagnosis recreational physical activity (highest vs. lowest physical activity categories) and breast cancer-related death in breat cancer survivors.
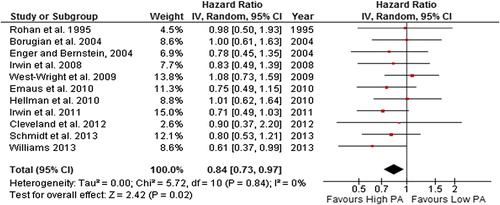
Figure 8. Forest plot with random effects overall hazard ratio for association between post-diagnosis recreational physical activity (highest vs. lowest physical activity categories) and all-cause death in breast cancer survivors.
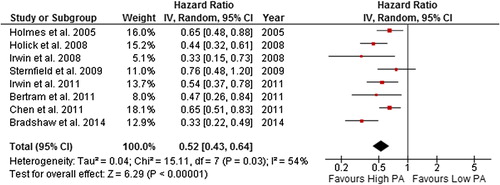
Figure 9. Forest plot with random effects overall hazard ratio for association between post-diagnosis recreational physical activity (highest vs. lowest physical activity categories) and breast cancer-related death in breast cancer survivors.
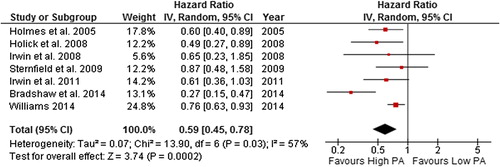
Figure 10. Forest plot with random effects overall hazard ratio for association between post-diagnosis meeting recommended physical activity guidelines (meeting vs. not meeting physical activity guidelines) and all-cause death in breast cancer survivors.
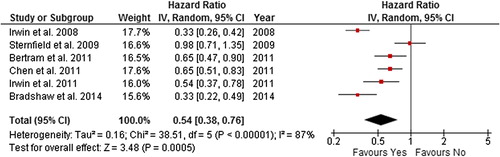
Figure 11. Forest plot with random effects overall hazard ratio for association between post-diagnosis meeting recommended physical activity guidelines (meeting vs. not meeting physical activity guidelines) and breast cancer-related death in breast cancer survivors.
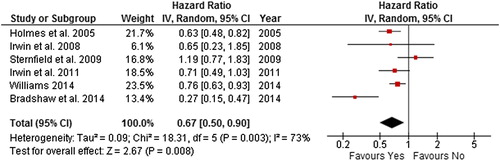
Figure 12. Forest plot with random effects overall hazard ratio for association between Pre-diagnosis physical activity (highest vs. lowest physical activity categories) and breast cancer events in breat cancer survivors.
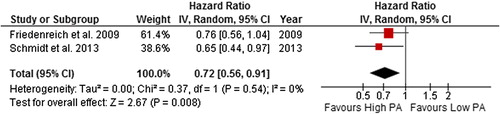
Figure 13. plot with random effects overall hazard ratio for association between Post-diagnosis physical activity (highest vs. lowest physical activity categories) and breast cancer events in breast cancer survivors.
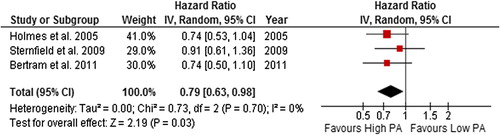
Table III. Summary of random effects overall hazard ratios (HR) and 95% confidence intervals (CI) for association between recreational physical activity (PA) variables and death and breast cancer (BC) events in breast cancer survivors.
Table IV. Summary of BMI and menopausal subgroup analyses by recreational physical activity (PA) variable.