
Figures & data
Figure 1. Flow diagram showing patient cohort selected for the study.
Figure 2. Normal pudendal nerve response (left panel) and absent pudendal nerve response with stimulus artifact (right panel) in a post-radiotherapy patient.
Figure 3. Relationship of the pudendal nerve (in green) with the target volumes (in blue) encompassed by the digitally reconstructed radiograph of the right lateral field corresponding to the simulated 2D (top left) and simulated 3D (top right) plans and actual 3D plan of the patient treated to the lesser pelvic nodes (bottom right) with a boost to the prostate bed (bottom left).
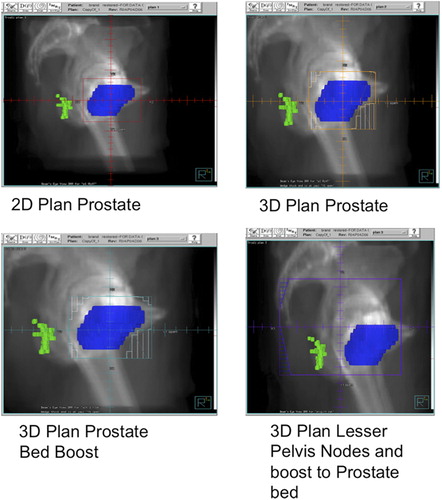
Table Ia. Effect on dose parameters of anal canal, rectum, pudendal nerve and prostate of 2D plan using 4 rectangular fields (AP/PA and laterals) targeting prostate to 66 Gy at isocentre in 33 fractions treating 5x/week in 14 patients.
Table Ib. Effect on dose parameters of anal canal, rectum, pudendal nerve and prostate of 3D plan using 5-field conformal technique targeting prostate to 74 Gy at isocenter in 37 fractions treating 5x/week in 2 patients.
Table Ic. Effect on dose parameters of anal canal, rectum, pudendal nerve and prostate of 3D plan using 4-field (AP/PA and laterals) conformal technique targeting lesser pelvic nodes to 45 Gy at isocenter in 25 fractions followed by boost to prostate bed for an additional 16.2 Gy at isocenter in 9 fractions treating 5x/week in 1 patient.
Table II. Patient demographics and previous surgical procedures. * p < 0.005.
Table III. PNTML measurements; Normal range for PNTML is 1.4–2.6 ms. * p < 0.001.
Table IV. MSP and MRP in the radiotherapy group subdivided by PNTML. p = NS. * below normal range.
Table V. Recto-anal inhibitory index (RAIR), volume to first rectal sensation and maximum tolerated rectal volume in the radiotherapy and non-radiotherapy groups. p = NS.