1,097
Views
15
CrossRef citations to date
0
Altmetric
ORIGINAL ARTICLE

Sick leave and disability pension among Swedish testicular cancer survivors according to clinical stage and treatment

, , , , , , , & show all
Pages 1770-1780 | Received 11 Dec 2014, Accepted 08 Feb 2015, Published online: 02 Apr 2015

Figures & data

Table I. Characteristics of testicular cancer survivors (TCSs) diagnosed in Sweden 2000–2007 (seminoma) or 1995–2007 (non-seminoma), and male population comparators matched to the patients by age and calendar year of diagnosis.

Figure 1. Total number of days of sick leave or disability pension from 2 years before, up to maximum 10 years after diagnosis (Dx) among TCSs and comparators (Comp). The numbers at risk and differences in mean annual days between TCSs and comparators, with 95% CI, are displayed below the graphs. Numbers within the bars represent percentages. The 75th percentile (p75) and 90th percentile (p90) are indicated by the lines and refers to the mean annual days of sick-leave or disability pension indicated on the secondary y-axis.

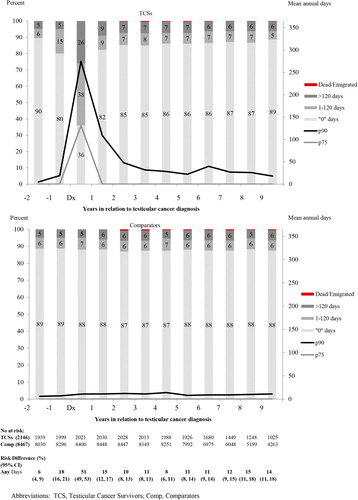
Table II. Relative risk (RR) and 95% confidence intervals (CI) of annual sick-leave or disability pension among TCSs compared with matched population comparators in the 3rd and 5th year after diagnosis. First, patients are grouped by tumor subtype and clinical stage (CS) and second by treatment modality. Follow-up is censored at relapse.

Table III. Mean days of sick-leave or disability pension among TCSs and population comparators (Comp) in the 3rd and 5th years after diagnosis. Patients are stratified by no or limited treatment versus extensive treatment, and then further by age, calendar period, educational level and previous sick-leave or disability pension. Follow-up is censored at relapse.

Figure 2. Mean annual days of sick-leave or disability pension from 2 years before, up to maximum 10 years after diagnosis (Dx) among TCSs treated with chemotherapy and population comparators. The numbers at risk and differences in mean annual days between TCSs and comparators, with 95% confidence intervals (CI), are displayed below the graph.

Table IV. Hazard ratio (HR) and 95% confidence intervals (CI) of disability pension among testicular cancer survivors (TCSs) compared with matched population comparators. First, patients are grouped by tumor subtype and clinical stage (CS) and second by treatment modality. Follow-up is censored at relapse.

Supplemental material

ionc_a_1020967_sm1445.pdf

Download PDF (302.9 KB)

Reprints and Corporate Permissions

Please note: Selecting permissions does not provide access to the full text of the article, please see our help page How do I view content?

To request a reprint or corporate permissions for this article, please click on the relevant link below:

Academic Permissions

Please note: Selecting permissions does not provide access to the full text of the article, please see our help page How do I view content?

Obtain permissions instantly via Rightslink by clicking on the button below:

If you are unable to obtain permissions via Rightslink, please complete and submit this Permissions form. For more information, please visit our Permissions help page.