
Figures & data
Figure 1. Magnitude of GTV and CTV shrinkage.
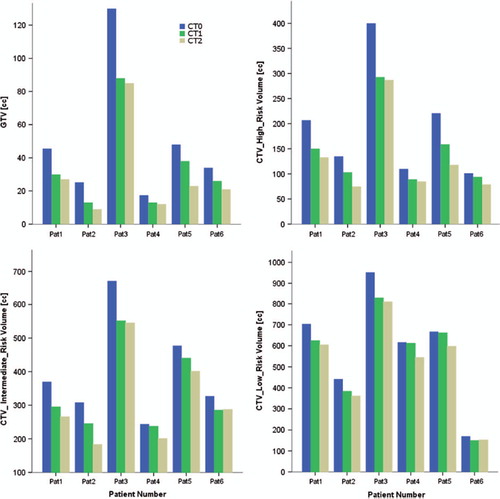
Figure 2. Dose distribution for the initial plan, non-adapted plan, adapted plan, a) VMAT technique for patient with large volume shrinkage, b) IMPT technique for patient with large volume shrinkage, c) VMAT technique for patient with small volume shrinkage, d) IMPT technique for patient with small volume shrinkage, blue lines – PTV volumes, black lines – OARs, i.e. spinal cord, parotid glands.
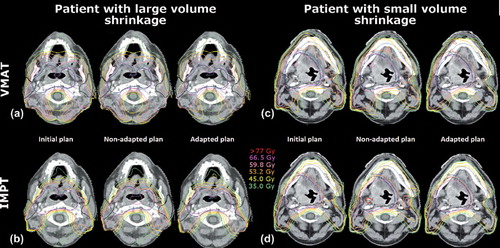
Figure 3. Dose volume histograms for patient with large volume changes a) and small volume changes b).
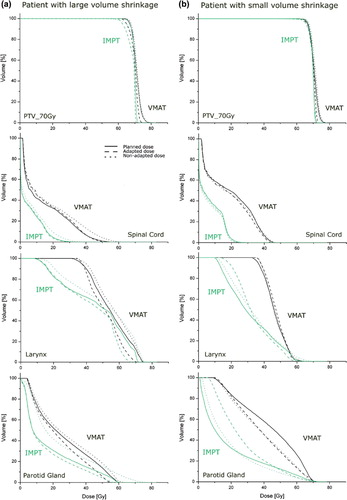
Table I. Variation of dosimetric treatment plan parameters for OARs and PTV structures for the various treatment scenarios. Volumes are specified as median and range (min, max) for 6 patients.
Table II. Variation of dosimetric treatment plan parameters for OARs and PTV structures in biweekly intervals. Volumes are specified as median and range (min and max) for 6 patients.
Supplemental material