
Figures & data
Table I. Patient characteristics.
Figure 1. Weekly percentage of patients with Grade 2 + CTCAE scores (A) for GI toxicities and (B) for HT.
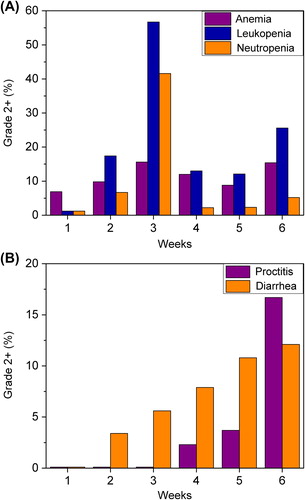
Figure 2. Comparison between the incidence of predicted Grade 2 + toxicity by applying the NTCP model and the actuarial incidence experienced by the study population for anemia. Patients were binned into six categories based on the predicted and actual toxicity, with 1 being the lowest toxicity group and 6 the highest.
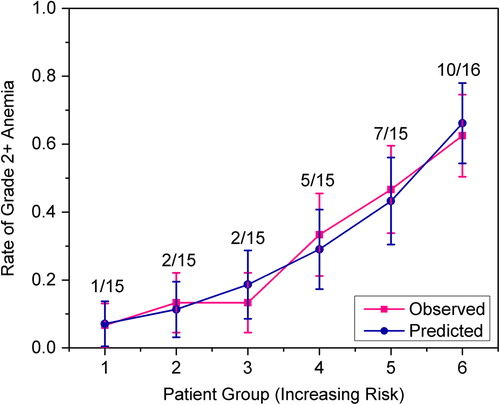
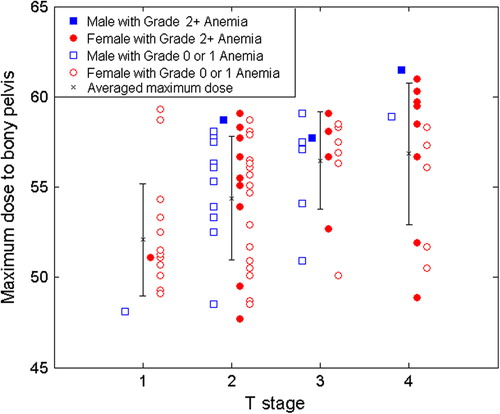
Figure 3. Scatter plot of the maximum dose to the bony pelvis by T stage, for male and female patients, with or without clinically significant anemia.
Supplemental material