2,939
Views
77
CrossRef citations to date
0
Altmetric
ORIGINAL ARTICLE

Comparing cone-beam CT intensity correction methods for dose recalculation in adaptive intensity-modulated photon and proton therapy for head and neck cancer

, , , , , , , , & show all
Pages 1651-1657 | Received 16 May 2015, Accepted 08 Jun 2015, Published online: 22 Jul 2015

Figures & data

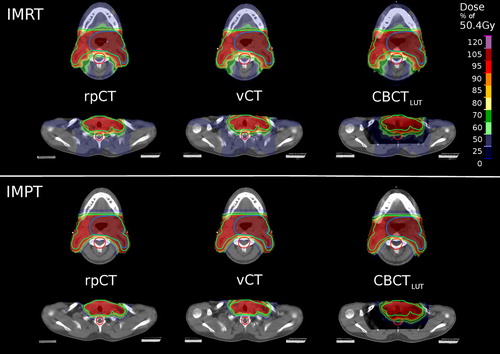
Figure 1. 2D IMRT (top part) and IMPT (bottom part) dose distributions (color-wash) on the investigated CT datasets for PatCA6 in an upper (top row of each part) and lower (bottom row) axial slice. The low and high dose PTVs (green and blue structures), as well as the spinal cord planning organ at risk volume (PRV, red structure) are also shown.
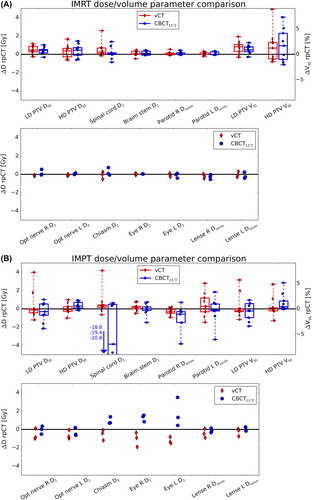
Figure 2. Comparison of IMRT (A, top) and IMPT (B, bottom) dose/volume parameters for vCT (red, diamonds) and CBCTLUT (blue, circles) dose recalculations. The dosimetric parameters correspond to the left, V95 to the right axis. For each parameter, the difference to the rpCT reference is given for every patient considering the total dose of the SIB treatment phase. For the optical system (only three patients) no boxplots were generated. For display purposes, data points below -5Gy difference are indicated by the arrow but not shown.

Table I. Gamma-index and proton range pass-rates for vCT and CBCTLUT dose recalculations.

Supplemental material

ionc_a_1061206_sm9800.pdf

Download PDF (816.3 KB)

Reprints and Corporate Permissions

Please note: Selecting permissions does not provide access to the full text of the article, please see our help page How do I view content?

To request a reprint or corporate permissions for this article, please click on the relevant link below:

Academic Permissions

Please note: Selecting permissions does not provide access to the full text of the article, please see our help page How do I view content?

Obtain permissions instantly via Rightslink by clicking on the button below:

If you are unable to obtain permissions via Rightslink, please complete and submit this Permissions form. For more information, please visit our Permissions help page.