Figures & data
Figure 1. IHC vs TSUVmax. Immunohistochemical stains versus TSUVmax. The proportion of positive cells have been binned in three groups, low expression (up to 1% positively stained cells) intermediate expression (> 1–33% positively stained cells) and high expression (> 33% positively stained cells) in order to have sufficient numbers in each stratum. p16 is scored dichotomously according to EORTCs p16 scoring guidelines [Citation18].
![Figure 1. IHC vs TSUVmax. Immunohistochemical stains versus TSUVmax. The proportion of positive cells have been binned in three groups, low expression (up to 1% positively stained cells) intermediate expression (> 1–33% positively stained cells) and high expression (> 33% positively stained cells) in order to have sufficient numbers in each stratum. p16 is scored dichotomously according to EORTCs p16 scoring guidelines [Citation18].](/cms/asset/dbc57432-f6c4-4792-90df-66ea2b8b8aac/ionc_a_1062539_f0001_b.gif)
Table I. Results of univariate and multivariate linear regression.
Figure 2. Proportion of p16 positive tumors. Logistic regression analysis of the probability of p16 positivity as a function of TSUVmax. Mean TSUVmax (with exact binomial confidence intervals) plotted for five 20 percentile groups based on TSUVmax. The knowledge of the TSUVmax of a tumor can be used to give a probability of the tumor being p16 positive. Logistic regression equation for p16: P = (exp(0.543+−0.108*TSUVmax))/(1 + exp(0.543+−0.108*TSUVmax)).
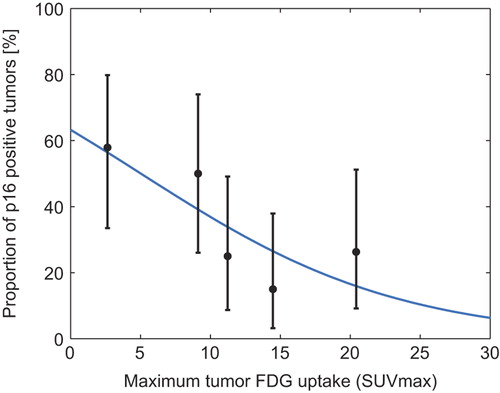
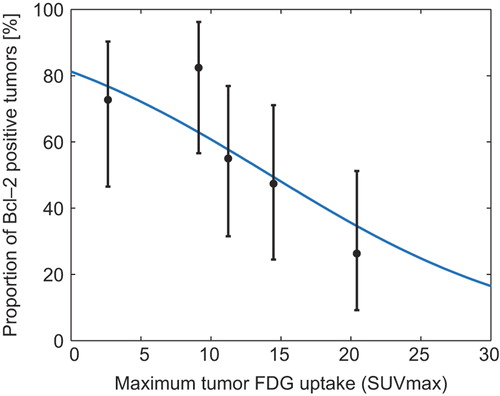
Figure 3. Proportion of Bcl-2 positive tumors. Logistic regression analysis of function with the probability of Bcl-2 positivity as a function of TSUVmax. Mean TSUVmax (with exact binomial confidence intervals) plotted for five 20 percentile groups based on TSUVmax. The knowledge of the TSUVmax of a tumor can be used to give a probability of the tumor being Bcl-2 positive. Logistic regression equation for Bcl-2: P = (exp(1.467+−0.103*TSUVmax))/(1 + exp(1.467+−0.103*TSUVmax)).