2,011
Views
16
CrossRef citations to date
0
Altmetric
ORIGINAL ARTICLE

Imaging of tumour hypoxia and metabolism in patients with head and neck squamous cell carcinoma

, , , , , & show all
Pages 1378-1384 | Received 14 May 2015, Accepted 19 Jun 2015, Published online: 27 Jul 2015

Figures & data

Figure 1. Good spatial overlap between [18F]FDG and [18F]HX4 uptake in a patient with a cT3N0M0 laryngeal carcinoma prior to start of radiotherapy. The interval between both scans was 8 days.
Figure 2. [18F]FDG and [18F] uptake in a patient with a cT2N2bM0 squamous cell carcinoma of the oropharynx. Even though both metastatic lymph nodes are highly [18F]FDG avid, only the lower lymph node (red arrow) also shows high [18F]HX4 PET uptake, whereas the other lymph node does not (white arrow). The interval between both scans was 5 days.

Table I. [18F]FDG and [18F]HX4 uptake parameters (mean± SD) for the primary lesions (GTVprim) and involved lymph nodes (GTVln).
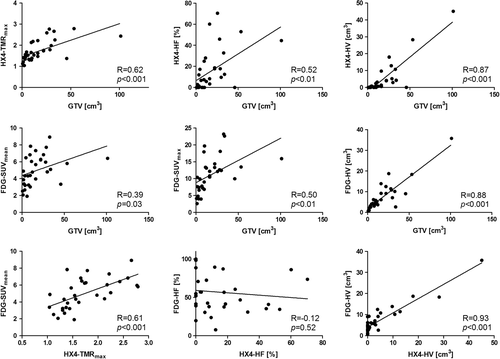
Figure 3. Correlation plots of the relationship between the gross tumour volume (GTV), FDG and HX4 uptake parameters.

Table II. Pearson's correlation coefficient (R) and corresponding p-values of the [18F]FDG and [18F]HX4 PET parameters from both the primary lesions and involved lymph nodes.

Figure 4. Visual representation of the overlap of [18F]FDG high fraction (blue) and [18F]HX4 high fraction (red) of the primary tumour (black) of all patients. The range of the [18F]FDG high fraction is from 8% (patient 18), to 100% (patient 6). The range of the [18F]HX4 high fraction is from 0% (Patient 4, 5, 6, 9, 14, 19 and 20) to 33% (Patient 11).
Supplemental material

ionc_a_1062913_sm4445.zip

Download Zip (266.6 KB)

Reprints and Corporate Permissions

Please note: Selecting permissions does not provide access to the full text of the article, please see our help page How do I view content?

To request a reprint or corporate permissions for this article, please click on the relevant link below:

Academic Permissions

Please note: Selecting permissions does not provide access to the full text of the article, please see our help page How do I view content?

Obtain permissions instantly via Rightslink by clicking on the button below:

If you are unable to obtain permissions via Rightslink, please complete and submit this Permissions form. For more information, please visit our Permissions help page.