Figures & data
Table I. The studied symptoms domains, symptom phrasing, moderate severity cut-off, and related proportions for both cohorts.
Table II. All MVA models with mean Az ≥ 0.50 sorted by the highest Az in each domain, and the dose/volume parameters with frequency > 5% for the models with the best discriminative ability (denoted by *).
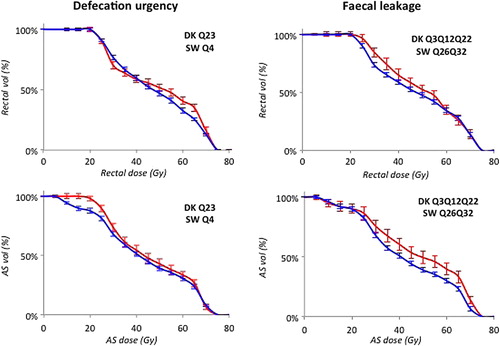
Figure 1. Population averaged dose-volume histograms for the highest frequency models of each symptom domain within the two cohorts (error bars denote 95% CI) for patients with < Moderate symptom severity (blue) and with ≥ Moderate symptom severity (red).
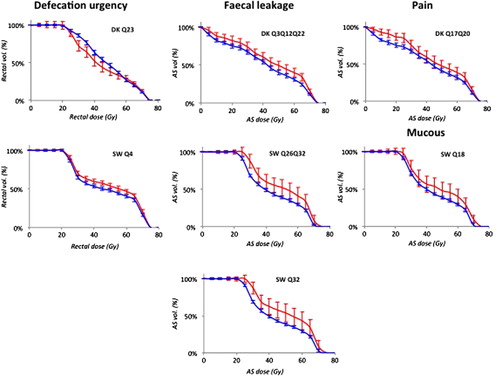
Table III. Best-fitting LKB model parameters for each symptom domain in DK, and in SW.
Figure 2. Population averaged dose-volume histograms for the highest-frequency models with the best discriminative ability of each symptom domain across the two cohorts (error bars denote 95% CI) for patients with < Moderate symptom severity (blue) and with ≥ Moderate symptom severity (red).