
Figures & data
Figure 1. Left: Radiotherapy planning CT acquired on a Philips Brilliance Big Bore CT scanner fitted with a flat couch. Right: T2-weighted MR image set acquired on a Siemens Symphony 1.5T scanner without a flat couch, which has been co-registered to the planning CT volume so that the image sets have the same resolution and geometry. The bladder, prostate and rectum contours were originally defined on the planning CT and then mapped to the MR using a rigid registration transform. It is clear from the position of these structures on the MR images that rigid registration results in significant errors in cross-modality mapping.
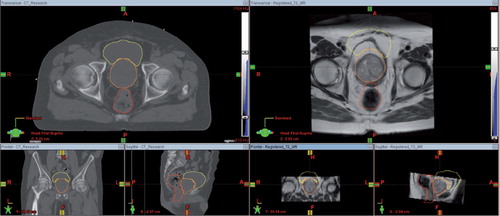
Figure 2. Left: Section of a T2-weighted MR image showing the prostate (red) and focal lesion (blue). Right: Section of the planning CT image with prostate (red) and rigidly registered focal contour (blue), which lies outside of the prostate volume. The result of non-rigidly registering the focal lesion (yellow) using the same deformation pattern that the prostate has undergone between MR and CT acquisition places the focal lesion inside the prostate.
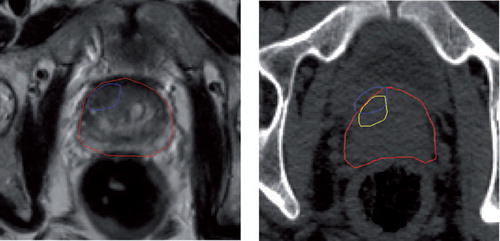
Table I. The OAR planning constraints used for the SABR-SIB plans, which were taken from the PACE radiotherapy trial [Citation13].
Table II. The biological models and parameters used in calculation of the TCP and NTCP between SABR-SIB plans and the original whole prostate plans [Citation22–24].
Table III. The dominant focal lesion and prostate volume for all patients and the results of assessment of the mapped contours using the non-rigid method. The p-value represents the difference between the ratio of the focal disease volume to the whole prostate volume between the two prescription groups.
Table IV. The results obtained from SABR-SIB plans produced to treat the dominant focal lesion.
Table V. Results of a comparison of NTCP and TCP between SABR-SIB plans and the original whole prostate plans.