1,815
Views
30
CrossRef citations to date
0
Altmetric
ORIGINAL ARTICLE

Evaluation of miR-21 and miR-375 as prognostic biomarkers in esophageal cancer

, , , , &
Pages 1582-1591 | Received 15 May 2015, Accepted 16 Jun 2015, Published online: 20 Oct 2015

Figures & data

Table I. Patient and tumor characteristics.

Table II. Uni- and multivariate analyses.
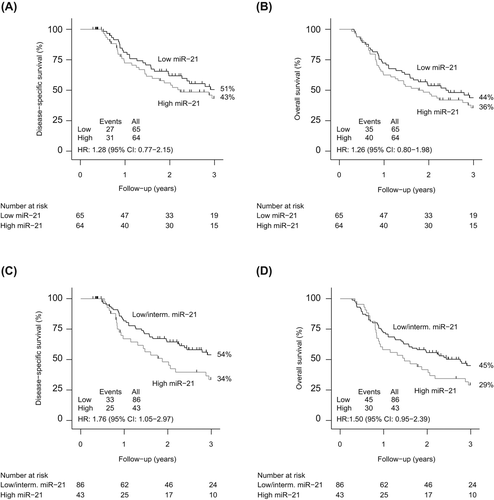
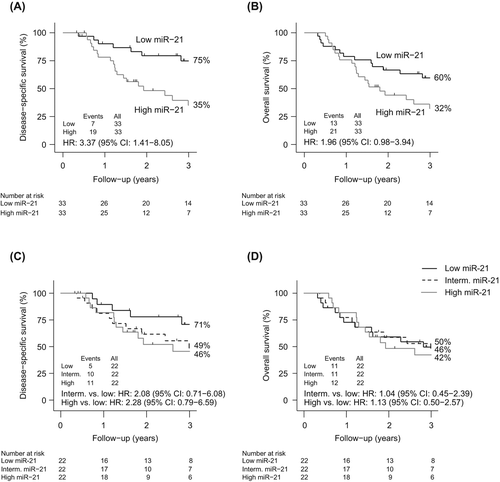
Figure 1. Kaplan-Meier estimates of miR-21 expression on survival in patients with ESCC. (A) DSS (divided by median expression), (B) OS (divided by median expression), (C) DSS (divided by tertiles – high exp. vs. low/interm. exp.) and (D) OS (divided by tertiles – high exp. vs. low/interm. exp.).
Figure 2. Kaplan-Meier estimates of miR-21 expression on survival in patients with EAC. (A) DSS (divided by median expression), (B) OS (divided by median expression), (C) DSS (divided by tertiles – high exp. vs. low/interm. exp.) and (D) OS (divided by tertiles – high exp. vs. low/interm. exp.).
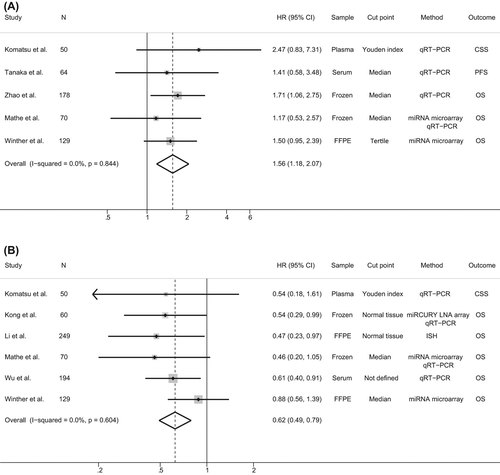
Figure 3. Forest plots evaluating the association between (A) miR-21 expression and prognosis in ESCC and (B) miR-375 expression and prognosis in ESCC. The squares represent study weights (inversely proportional to the standard error of the respective HRs) and are centred on the HR. 95% CIs are represented with whiskers. The dotted lines indicate the overall hazard ratio estimates.

Reprints and Corporate Permissions

Please note: Selecting permissions does not provide access to the full text of the article, please see our help page How do I view content?

To request a reprint or corporate permissions for this article, please click on the relevant link below:

Academic Permissions

Please note: Selecting permissions does not provide access to the full text of the article, please see our help page How do I view content?

Obtain permissions instantly via Rightslink by clicking on the button below:

If you are unable to obtain permissions via Rightslink, please complete and submit this Permissions form. For more information, please visit our Permissions help page.