Figures & data
Figure 1. 2D maps for all patients illustrating the wall thickness (mm) for the 50 ml distension volume. Axial coordinate indicates the longitudinal position of the central point of each slice along the curved centre of axis, abscissa coordinate is the angular position from −π to π, where coordinate 0 corresponds to the most anterior point at the most caudal part of the surface.
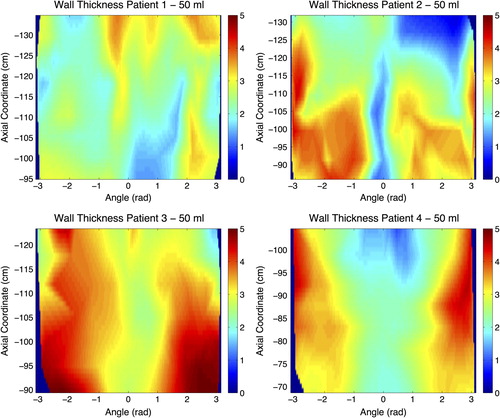
Figure 2. Box plots for the four patients and the wall thickness measurements at the 50 ml distension volume, and for the five rectal segments analysed.
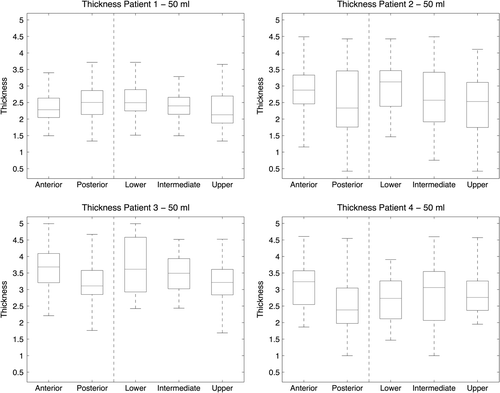
Table I. Pressure at each distension value for the 4 patients analysed, values missing correspond with non-tolerable distension volumes for the specific patient.
Figure 3. (Left panel) 2D map of strain for the 50 ml distension volume. Axial coordinate indicates the longitudinal position of the central point of each slice along the curved centre of axis, abscissa coordinate is the angular position from -π to π, where coordinate 0 corresponds with the most anterior point at most caudal part of the analysed surface. (Right panel) Box plot for the strain measurements at the 50 ml distension volume, and for the five rectal segments analysed.
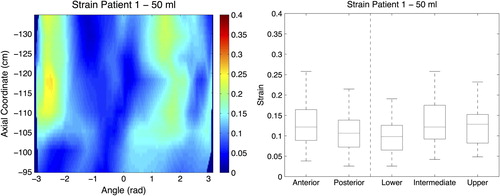
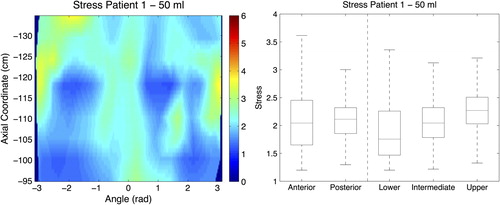
Figure 4. (Left panel) 2D map of stress for the 50 ml distension volume. Axial coordinate indicates the longitudinal position of the central point of each slice along the curved centre of axis, abscissa coordinate is the angular position from −π to π, where coordinate 0 corresponds with the most anterior point at most caudal part of the analysed surface. (Right panel) Box plot for the stress measurements at the 50 ml distension volume, and for the five rectal segments analysed.