Figures & data
Figure 1. TBRmax in patient groups with local tumor control (N = 15) and local failure (N = 7). The horizontal line depicts the median value.
Table I. Parameters of diagnostic accuracy for different offsets: False positive and true positive rate (FPR and TPR). Positive and negative predictive value (PPV and NPV). Log rank p.
Figure 2. ROC curve for the classification of tumors into local failure/local control groups with varying TBRmax offsets increasing from left to right and a constant TBRmax classification threshold of 2.0. Red crosses depict the estimated accuracies for offsets of -20%, -10%, 0%, + 10% and + 20% (from left to right) compared to reference conditions. The AUC is 0.77.
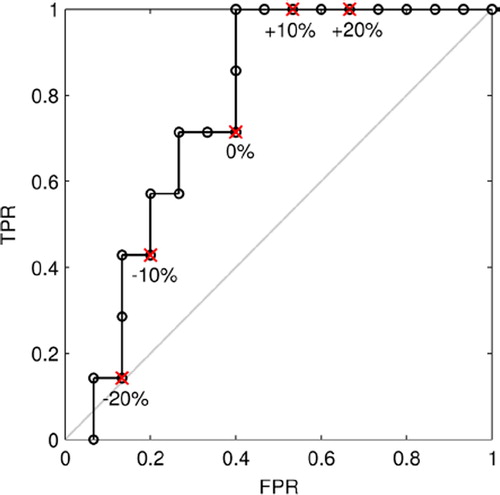
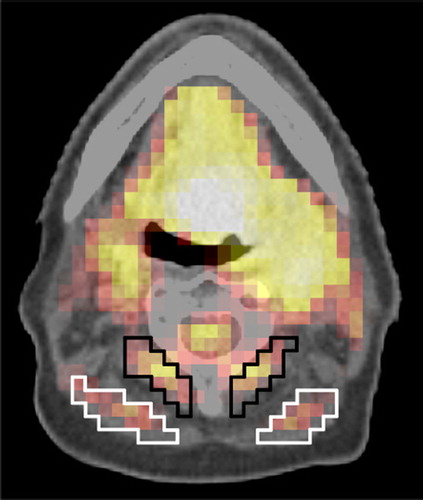
Figure 3. Examples of possible different background ROI definitions in neck muscles. The mean activities are 6.26 kBq/ml (SD 0.71) and 6.88 kBq/ml (SD 0.62) in the white and black region, respectively. The volumes of the black and white ROI are 3.3 cm3 and 3.9 cm3, respectively.