
Figures & data
Figure 1. Local progression-free survival for patients categorized as hypoxic during therapy with TBRmax > 1.93 in FMISOw2 (n = 12).
Table I. Patients' characteristics.
Figure 2. FMISO stability during treatment, boxplot showing 50% quartiles, whiskers showing whole range. (A) Dice index (Dice) with percentage of overlap, (B) bilateral mean contour distance (BMCD) and (C) distance of SUVmax between corresponding sequential FMISO scans.
Table II. Variations of FMISO hypoxic subvolumes during treatment.
Table III. Stability of hypoxic subvolume.
Figure 3. (A) Co-registration of FMISO subvolumes (FMISOpre = black, FMISOw1 = white, FMISOw2 = red, FMISOw5 = green) as delineated by one observer (NA) and projection of the location of maximum FMISO uptake (#) in serial FMISO-scans during therapy. Shown are the planning CTs with fusion of the FMISOw2-PET for two representative patients (# 1 and #8). Please note that the longitudinal distance between SUVmax (not shown here) substantially contributes to calculated distances. (B) Rigid co-registration of planning CT and PET-CT of local recurrence for the same patients with contours of FMISOpre (black) and FMISOw2 (red), pre-RT FDG-PET (light blue) and volume of recurrence (green). FMISO delineations of one observer (NA).
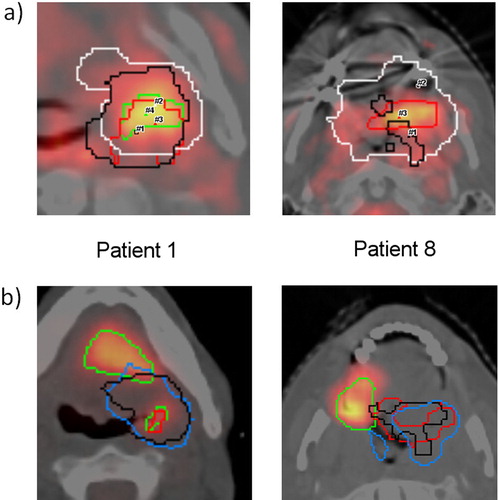
Table IV. Overlap and distances between geometric centres of recurrent tumour volume and FDG/FMISO PETs before/during treatment.