Figures & data
Figure 1. Age-specific cancer incidence for all sites except non-melanoma skin among Danish men. Separate curves for the periods 1978–1982, 1988–1992, 1998–2002, 2003–2007, and 2010–2012.
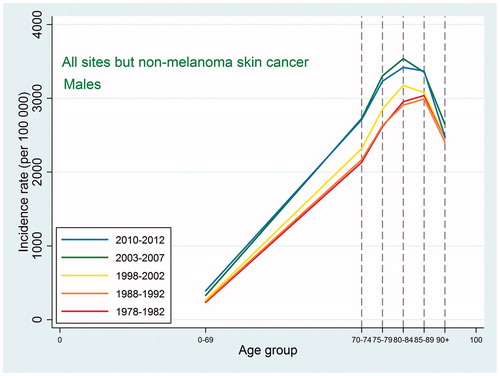
Figure 2. Age-specific cancer incidence for all sites except non-melanoma skin among Danish women. Separate curves for the periods 1978–1982, 1988–1992, 1998–2002, 2003–2007, and 2010–2012.
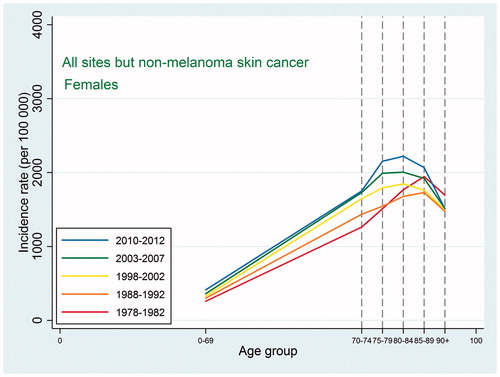
Figure 3. Age-specific cancer mortality for all sites except non-melanoma skin among Danish men. Separate curves for the periods 1978–1982, 1988–1992, 1998–2002, 2003–2007, and 2010–2012.
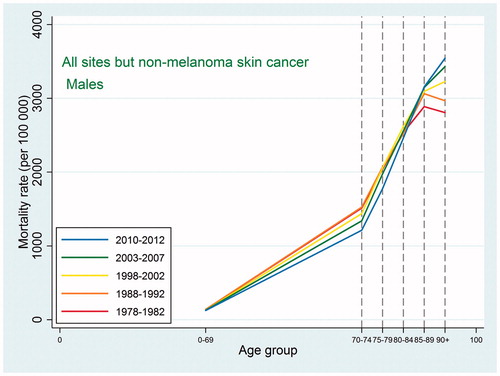
Figure 4. Age-specific cancer mortality for all sites except non-melanoma skin among Danish women. Separate curves for the periods 1978–1982, 1988–1992, 1998–2002, 2003–2007, and 2010–2012.
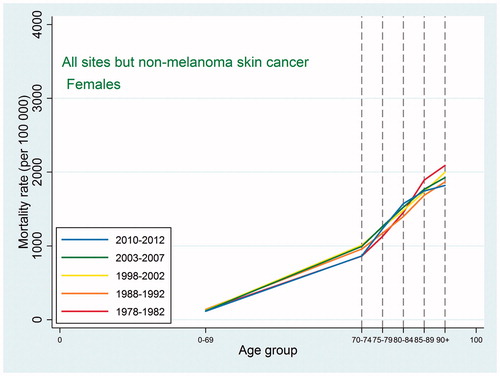
Figure 5. Age-specific cancer prevalence for all sites except non-melanoma skin among Danish men. Separate curves at time points 1980, 1990, 2000, 2005, 2010, and 2012 (on December 31).
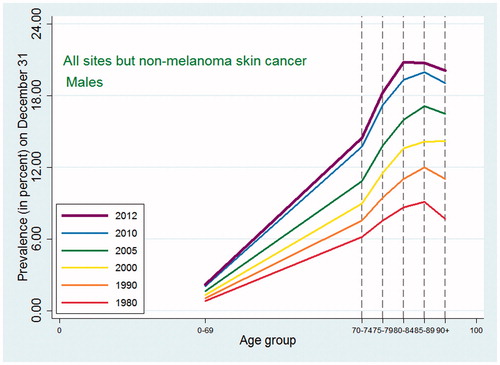
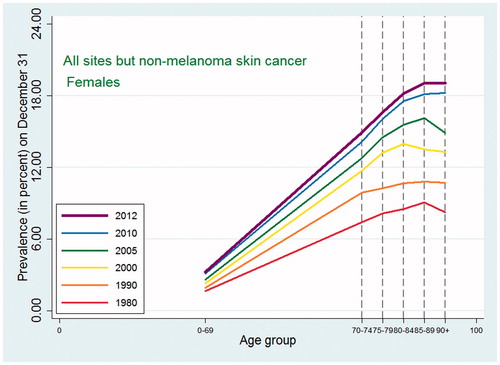
Figure 6. Age-specific cancer prevalence for all sites except non-melanoma skin among Danish women. Separate curves at time points 1980, 1990, 2000, 2005, 2010, and 2012 (on December 31).