
Figures & data
Figure 1. Incidence rates of colon cancer in Denmark, 1980–2012, by age group. A. Males, B. Females.
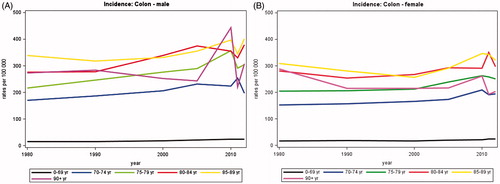
Table IA. Average annual number of new cases of colon cancer in Denmark.
Figure 2. Incidence rates of cancer of the rectum and anus for male and female in Denmark, 1980–2012, by age group. A. Males, B. Females.
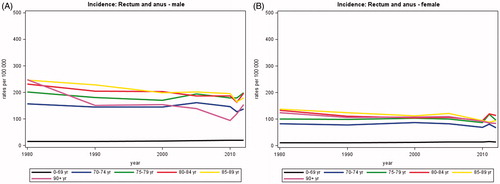
Table IB. Average annual number of new cases of cancer of the rectum and anus in Denmark.
Table IIA. Average annual number of deaths from colon cancer in Denmark.
Table IIB. Average annual number of deaths from cancer of the rectum and anus in Denmark.
Figure 3. Mortality rates of colon cancer in Denmark, 1980–2012, by age group. A. Males, B. Females.
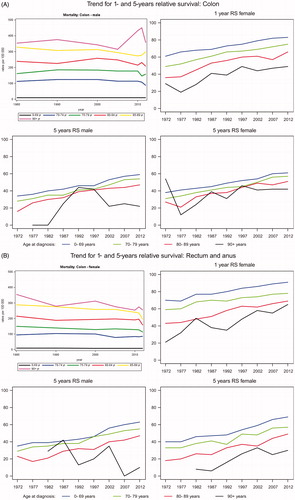
Figure 4. Mortality rates of cancer of the rectum and anus in Denmark, 1980–2012, by age group. A. Males, B. Females.
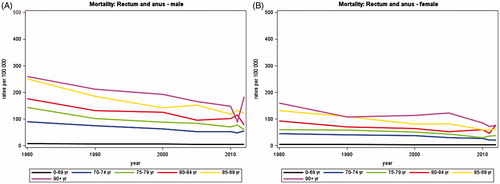
Figure 5. Age-specific relative survival after colon cancer in Denmark.
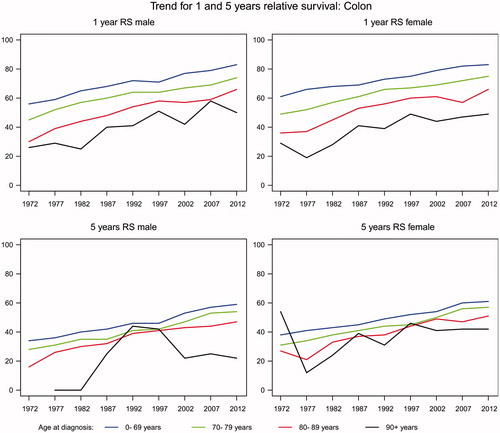
Figure 6. Age-specific relative survival after cancer of the rectum and anus in Denmark.
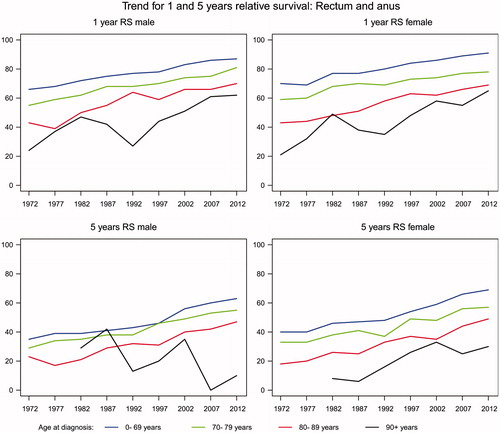
Table IIIA. Prevalence: Annual number of persons alive after colon cancer in Denmark by December 31.
Table IIIB. Prevalence: Annual number of persons alive after cancer of the rectum and anus in Denmark by December 31.