
Figures & data
Figure 1. Radiograph of hip joints in 54-year-old female patient with acute lymphoblastic leukemia showing osteonecrosis of the left femoral head (arrow) (A). Cross-section of the femoral head during the total hip arthroplasty procedure showing osteonecrotic lesion and partial collapse of the femoral head (arrow) (B).
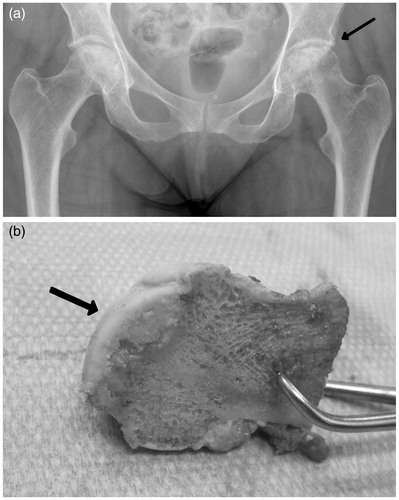
Figure 2. Flowchart of included patients with total joint arthroplasty performed between 2000 and 2012 after cancer diagnosis.
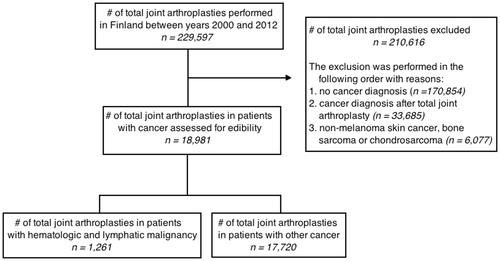
Table I. Patients with total joint arthroplasty performed between 2000 and 2012 after cancer diagnosis.
Table II. Standardized incidence ratios for all hematologic and lymphatic malignancies by age group.
Table III. Standardized incidence ratios for cancers other than hematologic or lymphatic malignancies by age group.
Table IV. Standardized incidence ratios for hematologic and lymphatic malignancies by malignancy type.