
Figures & data
Figure 1. Dose-volume histogram (DVH) for three plans for Patient 2. Mean esophageal dose (esophagus contoured with 4D information, Eso) is reduced from an average of 29.0 Gy in the non-sparing plan to 23.5 Gy and 15.8 Gy for the controlled sparing and extreme sparing plans, respectively. The largest dose reduction takes place in the overlapping area (Eso&PTV). DVH for total lung-PTV (TL) and contralateral lung (CL) are also shown. Squares: reference plan, triangles: extreme sparing plan, dots: controlled sparing plan.
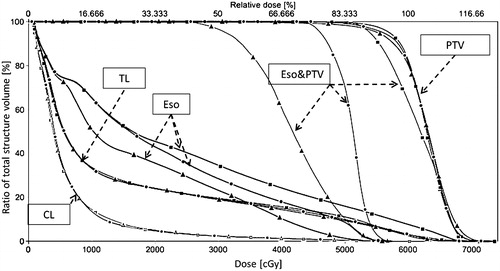
Table I. Dosimetric parameters of planning target volume and lung for controlled esophagus sparing and non-sparing plans.
Table II. Dosimetric parameters of the esophagus for controlled esophagus sparing and non-sparing treatment plans.