
Figures & data
Figure 1. Flowchart of the study.
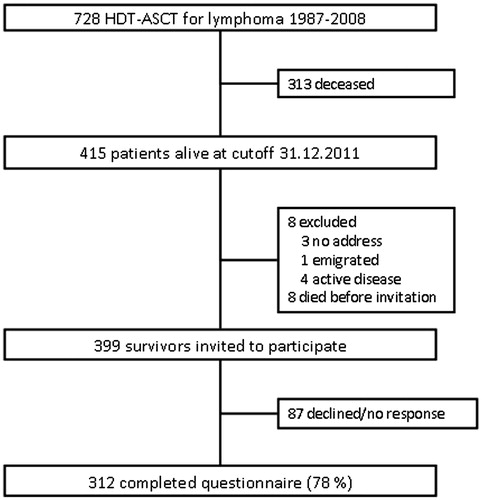
Figure 2. Proportions of employed patients over time according to sex and total sample (N = 312)*.
*The difference between men and women are p < 0.007 before and after HDT-ASCT and at survey. HDT-ASCT: high-dose chemotherapy with autologous stem cell transplantation.
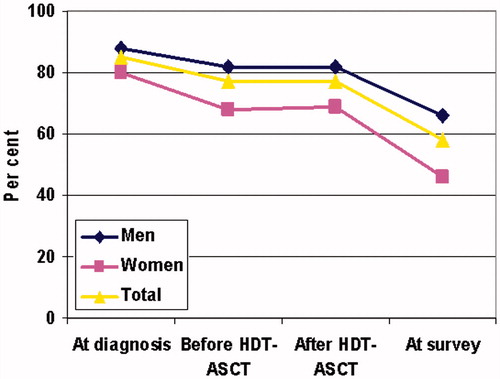
Table 1. Patterns of employment (E) and not-employment (N) over time (N=312).
Table 2. Demographic and disease characteristics of the sample according to work status at follow-up survey (N = 281).
Table 3. Fatigue, quality of life, mental problems and lifestyle of the sample according to employment status at follow-up survey (N = 281).
Table 4. Logistic regression analyses of independent variables and being currently unemployed (N = 102) with employed (N = 179) as reference.