
Figures & data
Table 1. Patients and tumor characteristics.
Figure 1. HER3 expression, IHC, grade 0 and grade 3 detected by HER3 monoclonal rabbit antibody (Abcam, SP71 ErbB, ab 93739, dil 1:800).
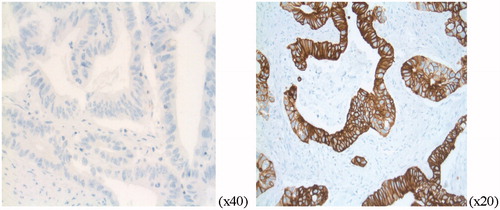
Table 2. HER3 expression grades in colon cancer, high vs. low expression.
Figure 2. Distribution of high HER3 expression related to colon tumor localization in 521 patients with colon cancer (p < 0.0001).
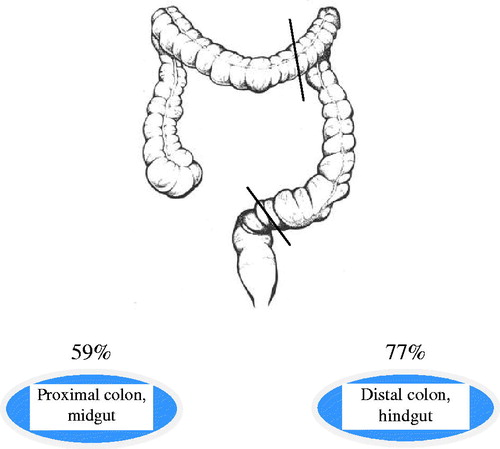
Figure 3. Disease-free survival in proximal and distal tumor location with respect to HER3 expression. For distal colon, the difference in DFS between low and high HER3 expressing tumor is significant (p = 0.03).
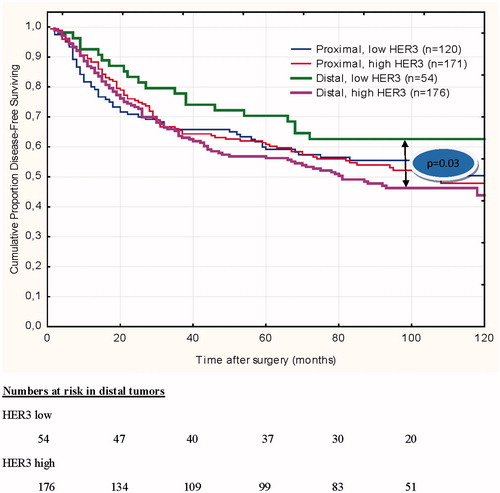
Table 3. Multivariate analysis for disease-free survival in distal colon tumors (n = 230).