
Figures & data
Figure 1. For all seven cases the difference between the proximal bronchial tree wall (PBT-Wall) dose based on the pretreatment CBCT and the planned fractional dose to the hottest 0.25, 0.5 and 1 cm3 of PBT-Wall is shown graphically.
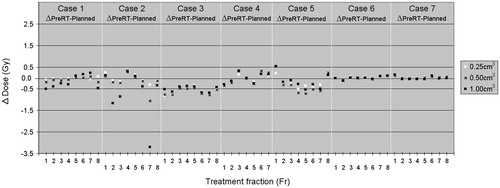
Figure 2. This illustrates the limited difference between the planned and delivered (pretreatment CBCT) position of the center of mass of the D0.5 cm3 PBT-Wall structure. All individual displacements in each translational direction have been combined (n = 165 individual x, y and z measurements combined) and 85% of differences were within ±2.0 mm.
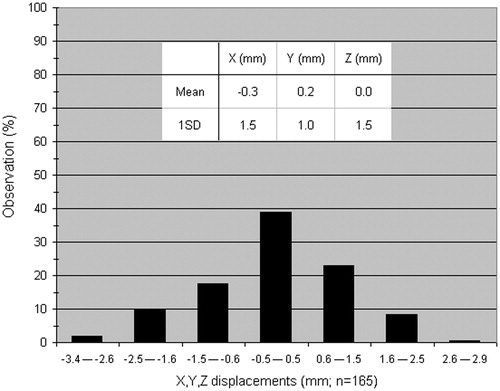
Table I. A summary of the differences between the estimated pretreatment dose and the planned dose for the “hottest” parts of the proximal bronchial tree wall (PBT-wall).