
Figures & data
Table 1. Mean absorbed doses, volumes, and standard deviations for potential trismus risk structures.
Figure 1. The relationships between dose to the masseter muscle and trismus (A) and the temporo-mandibular joint and trismus (B). Trismus according to MIO (maximal interincisal opening) ≤35 mm, GTQ (Gothenburg Trismus Questionnaire) answering categories 3–5, and EORTC QLQ-HN35 (European Organization for Research and Treatment of Cancer Head and Neck Questionnaire) answering categories 3–4.
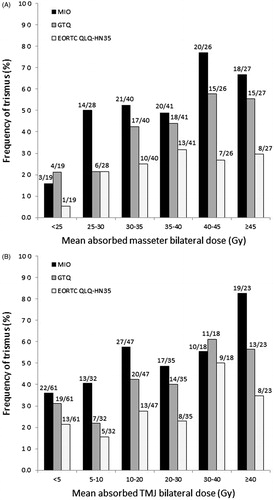
Table 2. Logistic regression and ROC analysis of risk structure doses as predictors for trismus in head and neck cancer patients treated with radiotherapy (bilateral mean dose).
Supplemental material