
Figures & data
Figure 1. Patients included, excluded, and allocated into risk groups and treatment. Patients to be included in the cohort, treated according to the DBCG 89 program and identified through the DBCG database (n = 1962). Patients excluded from the cohort (n = 115). Patients left for analyses (n = 1847) separated into low- and high-risk groups and further into treatment sub-groups.
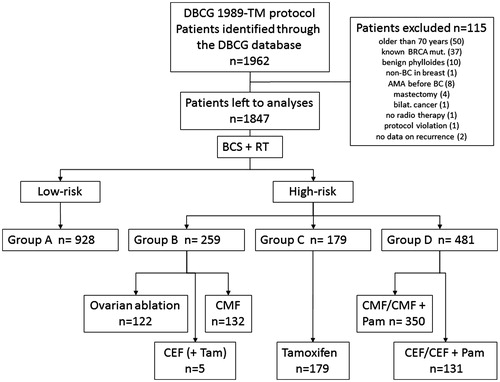
Table 1. Patient, tumor and treatment characteristics in the cohort and in age groups.
Figure 2. Cumulative incidences of first failures and survival endpoints for the entire cohort. A: Cumulative incidences of first failures at 20 years for the entire cohort, calculated in a competing risks model. B: Cumulative overall and recurrence-free survival at 20 years for the entire cohort.
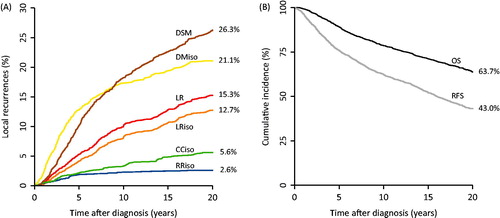
Table 2. Uni- and multivariate analyses of LR and DSM.
Figure 3. A: Hazard ratios for disease-specific mortality calculated in 5-year age intervals. B: Cumulative incidence of LR at 20 years in young, middle-aged and older patients. C: Cumulative incidence of distant metastases at 20 years in young, middle-aged and older patients. D: Cumulative overall survival at 20 years in young, middle-aged and older patients. E: Cumulative recurrence-free survival in young, middle-aged and older patients. F: Cumulative disease-specific mortality in young, middle-aged and older patients.
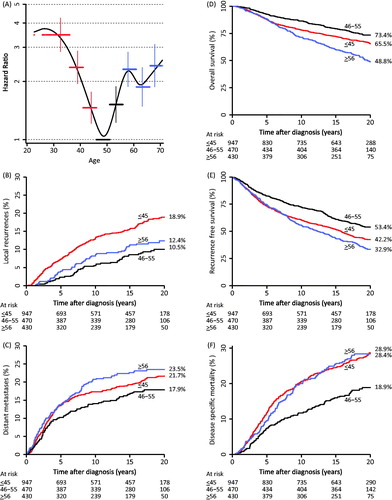
Table 3. Cumulative incidence proportions and HR of first failures and survival endpoints for the entire cohort and between age groups.
Table 4. Frequencies and proportions of first failures and subsequent metastatic disease.