Figures & data
Table 1. Patient and tumor characteristics in cohorts.
Figure 1. Repeatability and technical variability in the various steps in the qPCR procedures by independent replicate analysis of the same samples and plotted as correlations of delta Ct levels and as mean versus difference (Bland-Altman plot). Includes the 15 hypoxia-responsive genes and the three reference genes. Correlation of delta Ct levels in two different sections from the same sample (A). Delta Ct values from the same sample, repeated from RNA level (B). Delta Ct values from the same sample, repeated from cDNA level (C).
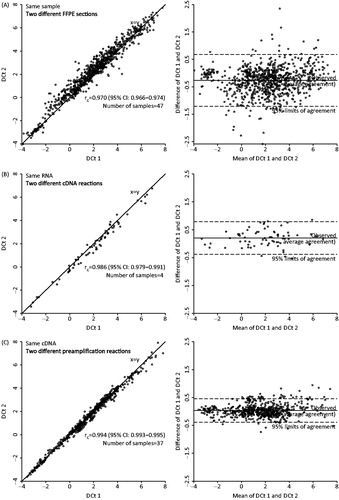
Figure 2. Delta Ct values for the 15 hypoxia-responsive genes from six sections from the same xenograft tumor samples.
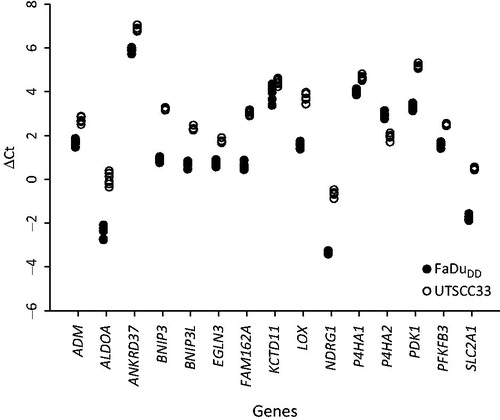
Figure 3. Reproducibility of the procedure tested by correlation of delta Ct levels of the 15 hypoxia-responsive genes and the three reference genes from two sections from each half of tumor pairs (each pair consisting of one FaDuDD and one UTSCC33) with one half of the tumors always fixed, embedded and cut at the central laboratory (ECO). Paired delta Ct levels are plotted against each other and as mean versus difference (Bland-Altman plot). Correlation of delta Ct levels of sections with the second halves fixed, embedded, and cut at ECO (A), at the local pathology department at Aarhus University Hospital (DoP) (B), and at seven different institutions in Europe (C).
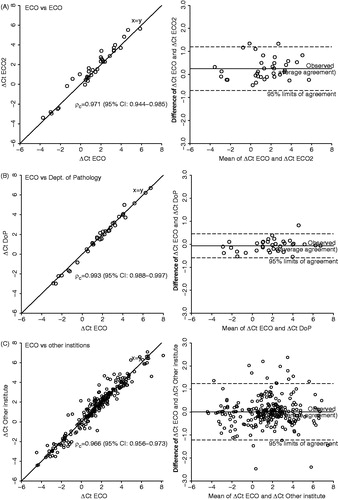
Figure 4. Classification of 510 independent samples from DAHANCA 5, 18, 24, and IAEA HypoX. Gene expression levels are shown as heatmap (each gene centered on the mean of the values characterizing ‘more’ and ‘less’ hypoxic tumors).
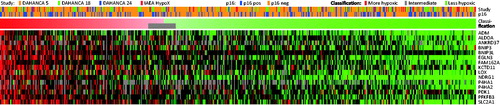
Table 2. Heterogeneity within classifier genes.
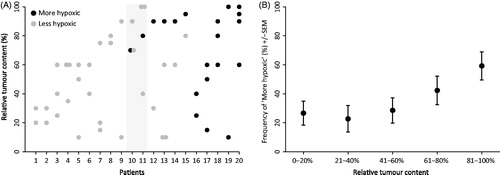
Figure 5. Intra-tumor heterogeneity. Classification of 20 patients with multiple biopsies, with shaded area indicating two patients where the biopsy with the highest tumor content did not reveal hypoxia, but another biopsy did (A). Classification of 129 samples from 96 patients plotted against tumor content in biopsy (B).