Figures & data
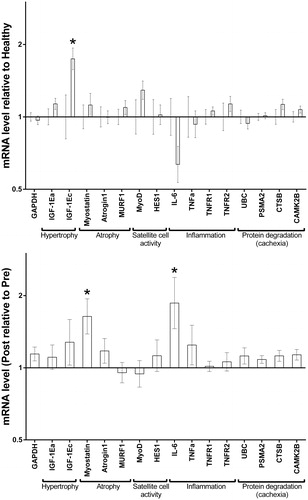
Figure 1. Satellite cells. Muscle satellite cell content from muscle biopsies, obtained as baseline (PRE) and after 9 weeks (POST) of chemotherapy and/or resistance exercise. Bars represent mean ± SEM for all fibers (A), and for Type I (B) and Type II (C) fibers at baseline for germ cell cancer patients (black bar, n = 26) and healthy controls (striped bar, n = 15), as well as change from baseline (white bars) to Week 9 (gray bars) for the INT-group (n = 8), CON-group (n = 9), and REF-group (n = 13), respectively. No significant differences were seen (all p > 0.05).
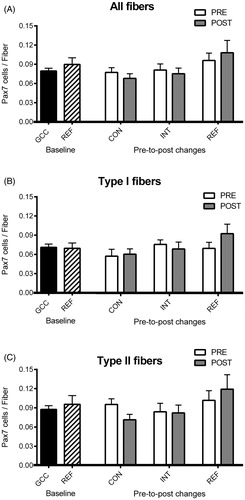
Figure 2. mRNA expression. Relative difference in mRNA expression of pathways involved in myofibrillar protein turnover in biopsies obtained at baseline and after 9 weeks of chemotherapy. mRNA data is presented as geometric mean ± back-transformed SEM, at baseline (A) for germ cell cancer patients (n = 26, right bar ± back-transformed SEM) relative to healthy individuals (n = 15, left; set to 1± back-transformed SEM), and change (B) at week 9 (POST, bar ± back-transformed SEM) in fold differences relative to baseline (PRE, set to 1) in the CON-group (n = 9). * = p < 0.05.