Figures & data
Figure 1. Genotyping strategy. The forward primer is located in human Runx1a, the reverse primer binds to the IRES sequence.
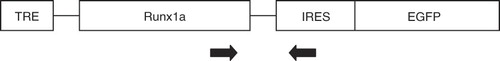
Table I. Genotyping of transgenic mice.
Figure 2. Newly formed neurospheres under doxycycline (DOX) treatment (A) and without DOX (B). Neurospheres 48 hours after removal of mitogens under DOX treatment (C) or without DOX (D). Numerous GFAP+ cells (green), but almost no bTUB+ cells (red) are present in DOX-treated neurospheres (C), whereas in untreated neurospheres numerous bTUB+ (red) and some GFAP+ (green) cells are present (D). Blue = Hoechst nuclear labeling. Culture of NCSCs after 1 week in differentiation assay. E and F: phase contrast of DOX-treated (E) and untreated (F) cultures. G–I = attached EGFP+ cells with glial type morphologies. Scale bar = 100 μm (A, B); 50 μm (C–I). D with permission from Lippincott Williams & Wilkins.
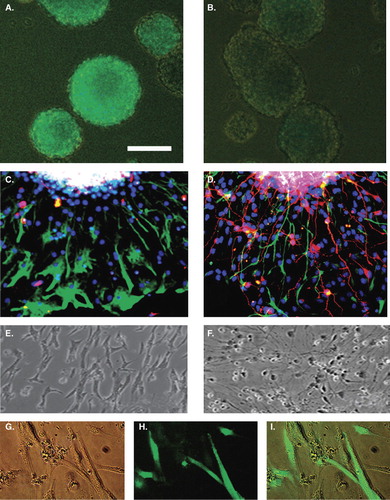
Figure 3. Culture of NCSCs 1 week after removal of mitogens. Doxycycline (DOX)-treated (A, C) or untreated (B, D) cultures display a striking difference in neuronal/glial relationship. In DOX-treated cultures there is an abundance of GFAP+ cells, and only few bTUB+ cells, whereas in untreated cultures GFAP+ and bTUB+ cells are both abundant. This situation is verified by the quantitative analysis of the number of GFAP+ and bTUB+ cells in DOX-treated and untreated cultures (E, F). Scale bar = 50 μm (A–D).
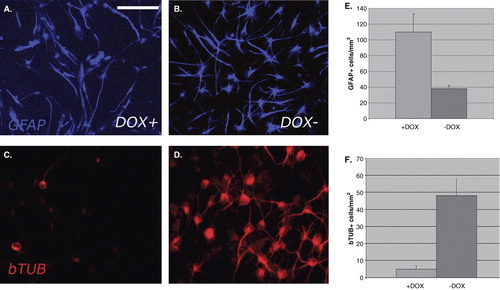
Figure 4. Immunocytochemistry of DOX-treated cultures, showing labeling with the glial cell markers Mts1/S100A4 (green) as well as Sox10 (red). Scale bar = 25 μm (A–C).
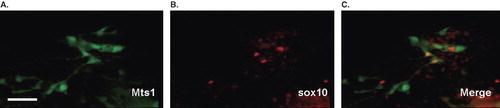
Figure 5. Comparison between new-born normal mice and new-born mice in which Runx1a expression was activated during embryonic days 8–11. Note the small body size and pigment defects (A, right), megacolon (B, left), and small DRG size (D compared to C) following Runx1a activation. DRGs are labeled with the neuronal markers beta-tubulin (green) and peripherin (red). Scale bar = 100 μm (C, D).
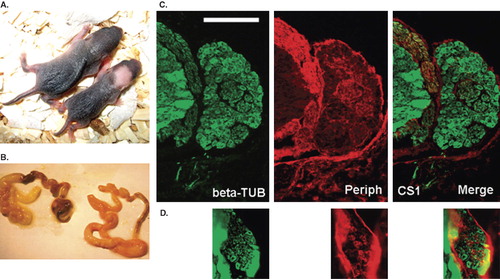
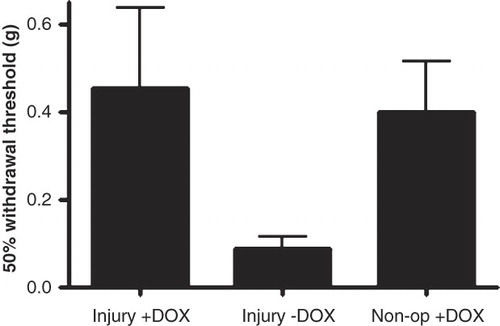
Figure 6. Sensitivity to von Frey filament stimulation of the hind paw assessed with the 50% withdrawal threshold in grams 14 days after a chronic constriction injury of the ipsilateral sciatic nerve.