Figures & data
Table I. Sialic acid and sulfonated GalNAc residues per LH and FSH molecule in serum and frequency of isoforms with zero to four sulfonated GalNAc residues. Four groups of post-menopausal women: non-treated, treated with 20 mg E2 implant, and, in addition to E2, with 2 and 4 weeks of oral therapy with 5 mg NETA daily.
Figure 1. Relationship between LH concentration and changes in the number of sialic acid (open star) and sulfonated (filled circle) residues and negatively charged residues (filled square) on the oligosaccharides per LH molecule after 2 and 4 weeks of NETA therapy in two E2-implant-treated post-menopausal women. The average numbers of sialic acid (SA-) and sulfonated (SO3-) residues per serum LH molecule at the start of NETA treatment are given (w = weeks).
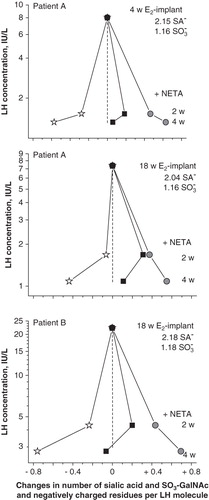
Figure 2. Relationship between FSH concentration and changes in the number of sialic acid (open star) and sulfonated (filled circle) residues and negatively charged residues (filled square) on the oligosaccharides per FSH molecule after 2 and 4 weeks of NETA therapy in two E2-implant-treated post-menopausal women. The average numbers of sialic acid (SA-) and sulfonated (SO3-) residues per serum FSH molecule at the start of NETA treatment are given (w = weeks).
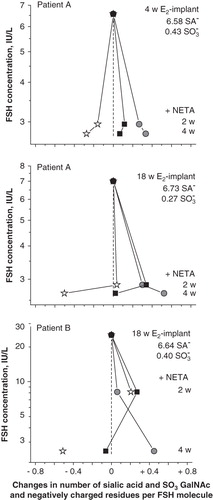
Figure 3. Mean ± SEM of average number of sialic acid (lower panels) and sulfonated GalNAc (upper panels) residues per serum LH (left panels) and FSH (right panels) molecule in four groups of post-menopausal women. NETA was given to E2-implant-treated women, and sera were taken at the start (E2-implant) and after 2 (E2+2wNETA) and 4 (E2+4wNETA) weeks of treatment (non-treated = a reference group of non-treated post-menopausal women). Statistical comparison with preceding group. *P < 0.05; **P < 0.01; ***P < 0.001. Figures in parentheses indicate number of women in each group.
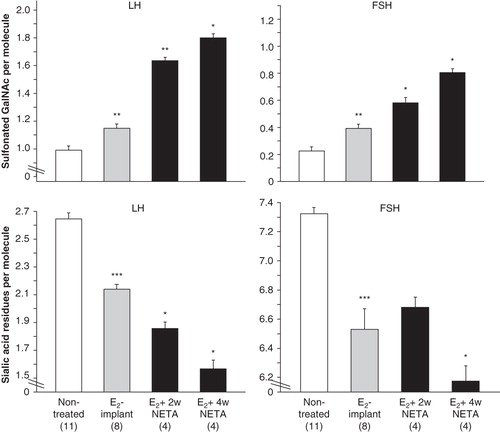
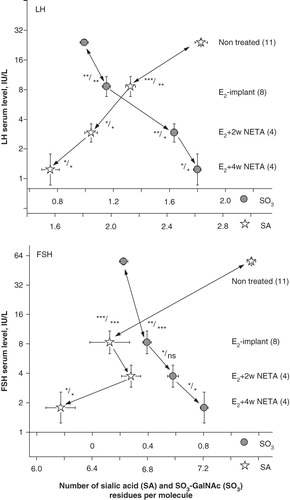
Figure 4. Relationship between serum LH (upper panel) and FSH (lower panel) concentration and number of sialic acid (open star) and sulfonated GalNAc (filled circle) residues per molecule in four groups of post-menopausal women. NETA was given to E2-implant-treated women, and sera were taken at the start (E2-implant) and after 2 (E2+2wNETA) and 4 (E2+4wNETA) weeks of treatment (non-treated = a reference group of nine non-treated post-menopausal women). Significance of difference in number of residues/concentration is indicated. *P < 0.05; **P < 0.01; ***P < 0.001; ns = not significant. Figures in parentheses indicate number of women in each group.