Figures & data
Figure 1. Design of degenerate primers for PCR and single retinal ganglion cell isolation. A: Schematic diagram of receptor tyrosine kinases (RTKs) and degenerate primers with alignment of the amino acid sequences in conserved regions of the tyrosine kinase domain (HRDLAARN and DVWS(F/Y)G(V/I)) in the identified RTKs, which were used for the primer design. The oligonucleotide sequences are shown in international union of biochemistry (IUB) nucleotide codes. Identical conserved amino acids are boxed in black and less well conserved in grey. Bright-field (B) and fluorescence micrographs (C) showing a labelled single retinal ganglion cell in process for aspiration. Scale bar 20 μm valid for B and C.
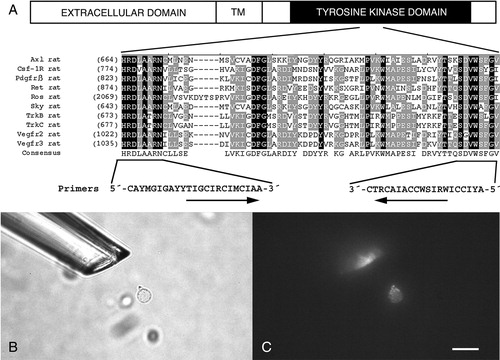
Table I. PCR primer sequences.
Table II. Oligonucleotide in situ probe sequences.
Table III. Real time PCR primer sequences.
Figure 2. Agarose gel electrophoresis analysis of PCR products from single-cell degenerate primer PCR. A: Control analyses of the single-cell PCR showing negative and positive control reactions. (Lanes: neg. ctrl., PCR on cDNA reaction without reverse transcriptase; single retinal ganglion cell cDNA analysed using specific primers to Gapdh and TrkB; neg. ctrl. medium, control for extracellular RNA contamination; Actin cDNA and Actin genomic, controls for cDNA synthesis and genomic DNA contamination with primers that give a 138 bp fragment with the actin cDNA and 601 bp with genomic DNA as templates; M, 100 bp DNA size marker ladder). B: PCR on seven representative single cells using degenerate primers directed towards conserved sequences in the tyrosine kinase domain of receptor tyrosine kinases. (Lanes: negative controls and markers as in A; positive control using specific primers for Actin and Gapdh; 1–7, degenerate primer PCR on single retinal ganglion cell cDNA). Specific PCR products are approximately 220 bp. Cells 2, 3, 5, and 7 are considered positive, while 1, 4, and 6 are negative.
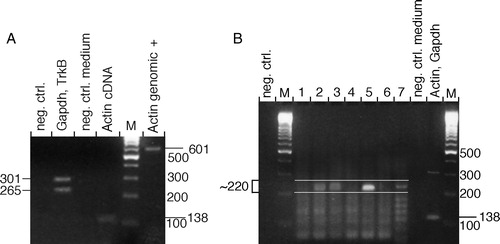
Table IV. Summary of receptor tyrosine kinase (RTK) expression in adult rat retina and retinal ganglion cells (RGCs).
Figure 3. Expression of receptor tyrosine kinase (RTK) mRNA in the retinal ganglion cell layer. Bright-field micrographs of oligonucleotide probe in situ hybridization analysis of the retinal ganglion cell layer in adult rat. Autoradiography for Axl (A), Sky (C), Vegfr-2 (E), Csf-1R (G), Pdgfrβ (I), Pdgfrα (K), TrkB (M), Ret (N), and Met (O) mRNA expression. B, D, F, H, J, and L: negative controls using 100 times molar excess of unlabelled oligonucleotides (GCL = ganglion cell layer). Scale bars 20 μm. Bar in B also valid for A, bar in D also valid for C–L, and bar in O also valid for M–N.
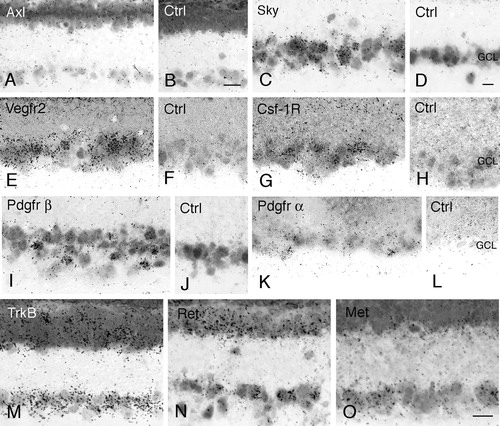
Figure 4. Immunohistochemical localization of Pdgf receptors in the retinal ganglion cell layer. Immunohistochemistry using an antibody against both α and β forms of the Pdgf receptor. A, B, and D: Bright-field micrographs of adult rat retina with immunoreactivity visualized using diaminobenzidine precipitates. A, B: Micrographs of the vitreal side of whole-mount retina preparation with the focus plane in the ganglion cell layer. Pdgfrα,β immunoreactive cell (arrow). Immunoreactivity could also be seen in the optic fibre layer (out of focus in panels A and B but visible in cross-section shown in D). C–E: Cross-sections of retina with FluoroGold-labelled RGCs. C: Fluorescence micrograph showing FluoroGold-labelled RGCs (arrow-head). D: Pdgfrα,β immunoreactivity in the same section as shown in C. Note the displaced RGC in C, which is also labelled for Pdgfrα,β. E: Negative control (GCL = ganglion cell layer; OFL = nerve fibre layer; RGCs = retinal ganglion cells). Scale bar in A, B, and E, 20 μm, also valid for C and D.
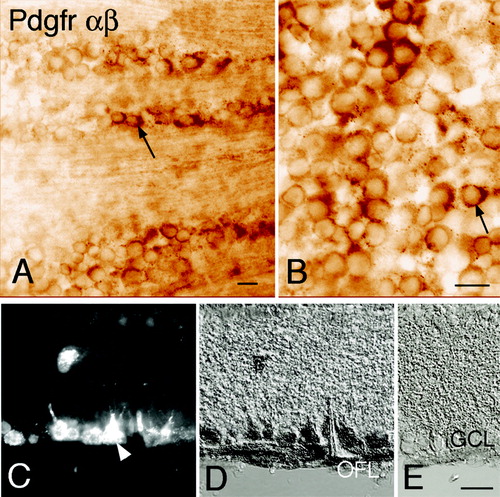
Figure 5. Immunohistochemical localization of receptor tyrosine kinases (RTKs) in retrogradely filled retinal ganglion cells. Adult rat retinal ganglion cells (RGCs) were retrogradely filled with True Blue from the superior colliculi, and cross-sections of the retinas were subjected to epifluorescence immunohistochemistry. A, E, I, M, and Q: Micrographs showing RGCs with True Blue fluorescence (blue). B: Sky; F, N, and R: Vegfr-2; V: Ret immunoreactivity (green). J, O, and U: Csf-1R; and S: TrkB immunoreactivity (red). C, G, K, P, T, and X: Merge of panels to the left on same row. Arrows indicate labelled (A–K) and double-labelled (M–X) True Blue-identified RGCs. Arrow-heads indicate single-labelled RGCs. D, H, and L: Negative controls (GCL = ganglion cell layer). Scale bars in L and T are 25 μm and are also valid for A–T. Scale bar in X is 40 μm, also valid for U and V.
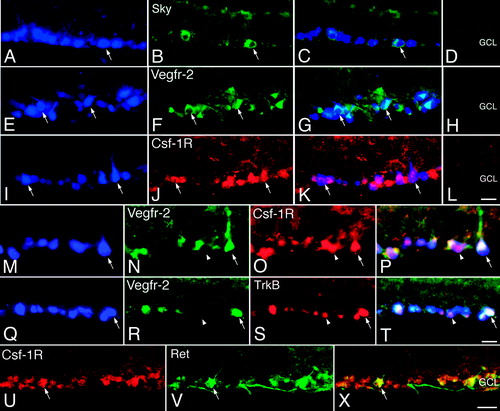
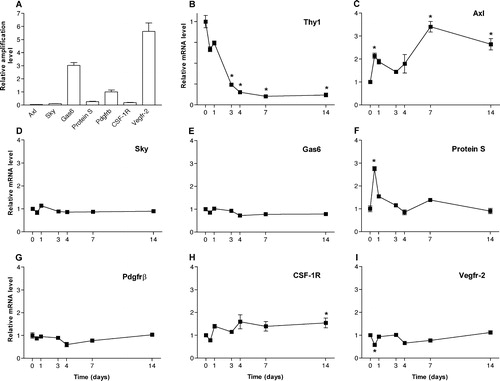
Figure 6. Relative mRNA levels in normal retina and retina from rats 12 hours, 1, 3, 4, 7, and 14 days after optic nerve transection. Relative mRNA levels were analysed using quantitative real-time PCR analysis. A: Relative amplification levels in normal retina. Relative mRNA levels for Thy-1 (B), Axl (C), Sky (D), Gas6 (E), ProteinS (F), Pdgfrβ (G), Csf-1R (H), and Vegfr-2 (I). Time point 0 represents normal levels and was assigned the value of 1. n = 6. Error bars show SEM. * indicates P < 0.05 ANOVA.