Figures & data
Table I. Description of behaviours registered after intravenous ethanol administration.
Figure 1. CSF 5-HIAA levels were lower in animals with low platelet MAO-B activity (t = −2.39, P < 0.05). Box plot with whiskers showing largest and smallest observation. The boxes represent the lower and the upper quartiles with the median value marked as a line within the boxes.
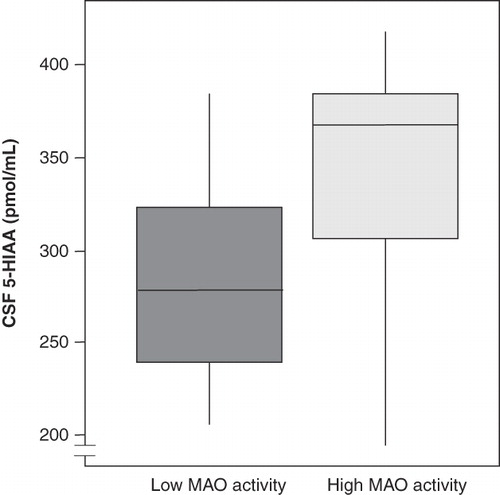
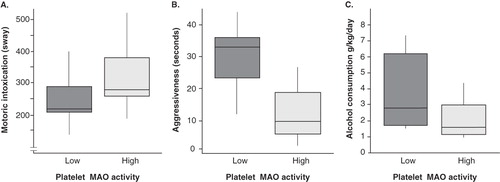
Figure 2. A: Motoric intoxication scores were lower in monkeys with low platelet MAO-B activity than in monkeys with high platelet MAO-B activity (t = −2.10, P < 0.05). Reported as frequency. B: Monkeys with low platelet MAO-B activity showed more aggressive behaviour after alcohol infusion (t = 4.55, P < 0.001). Stare threats. C: Monkeys with low platelet MAO-B activity consumed more alcohol than monkeys with high MAO-B activity (t = 2.15, P < 0.05). Mean alcohol intake per day during the two-weeks period. Box plots with whiskers showing largest and smallest observation. The boxes represent the lower and the upper quartiles with the median value marked as a line within the boxes.